Posted on 04/23/2013 7:35:53 AM PDT by blam
Gold, Stocks And Copper Set To Crash
Commodities / Financial Crash
April 23, 2013 - 06:34 AM GMT
By: Clive Maund
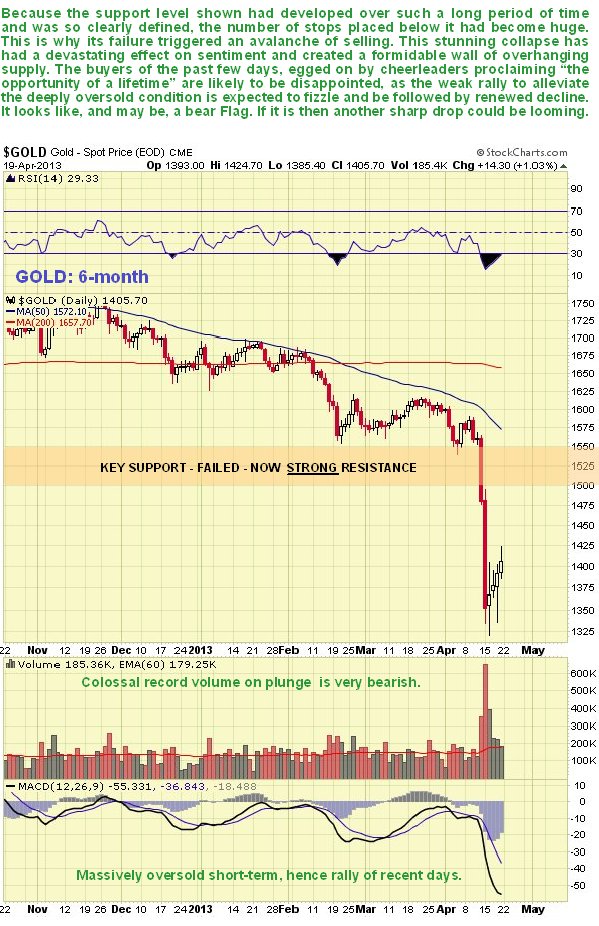
Failure of gold's key support at $1500 - $1550 triggered a stunning plunge as masses of stops were triggered. We can see what happened on the 6-month chart below. The plunge was the most severe since 1980 and was accompanied by colossal record volume, which is strongly bearish. It quickly lead to gold becoming critically oversold and it bounced later in the week as cheerleaders advised their readers to buy this "opportunity of a lifetime". Is it? In this update we will consider the implications of this extraordinary breakdown.
In the first case a plunge of this nature has shattered confidence, which in the best of circumstances will need time to recover, so any premature rally attempt can be expected to fail. What was strong support at $1500 - $1550 is now strong resistance, as all those "hung up" in the top area will take any opportunity to sell onto a rally that approaches this price level. The second important point to note is that a dramatic breakdown on heavy volume such as this is normally a very bearish development that kicks off a longer-term decline. Worst case now is that a bear Flag forms for a short time, perhaps a week or two, which allows the short-term deeply oversold condition to unwind, before another brutal plunge ensues - and it looks like this is what is happening. At the time of posting this (Monday morning) gold is continuing to creep higher and is starting to look like a good short.
In the last update we opined that Big Money, aware of the mass of stops beneath the key support, was conspiring to trip them in order to trigger a collapse which would enable them to replenish their run down gold inventories at a relatively low price, but there is a darker explanation for their earlier big inventory rundown, which is that they had seen "the writing on the wall" and were offloading their inventory at top dollar in the large top area as fast as they possibly could ahead of a collapse. Many are now protesting "How could gold collapse when its fundamentals are so strong?, overlooking the fact that that is precisely when bearmarkets start, because all of the good news is known to the market and priced in.
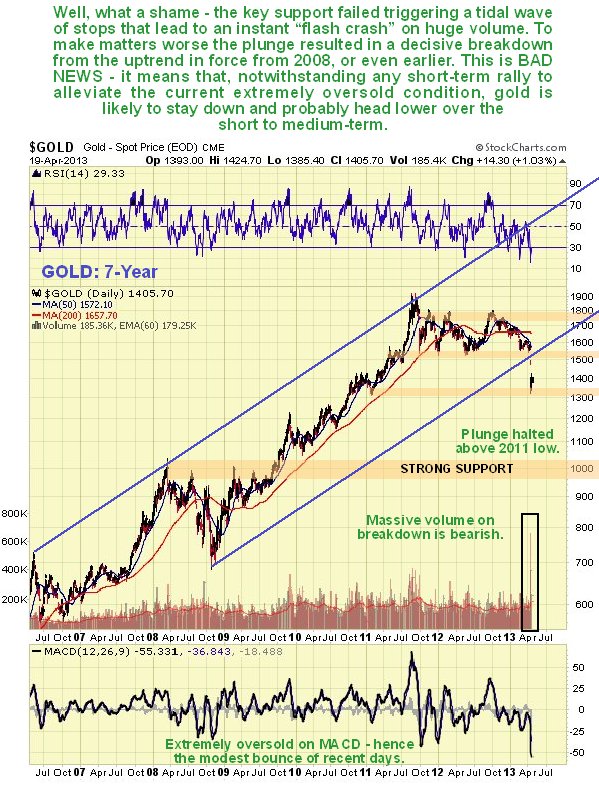
On its 7-year chart we can see that not only did gold crash key support when it plunged, but it also simultaneously broke down from its long-term uptrend in force from 2008, or longer if you take it from its top channel line. This was another strongly bearish development and while the plunge suddenly stopped at the support approaching its early 2011 low, the decline looks set to resume once the massively oversold condition has eased somewhat. There is no serious support until it gets down to the $1000 area, which is where it looks like it is headed.
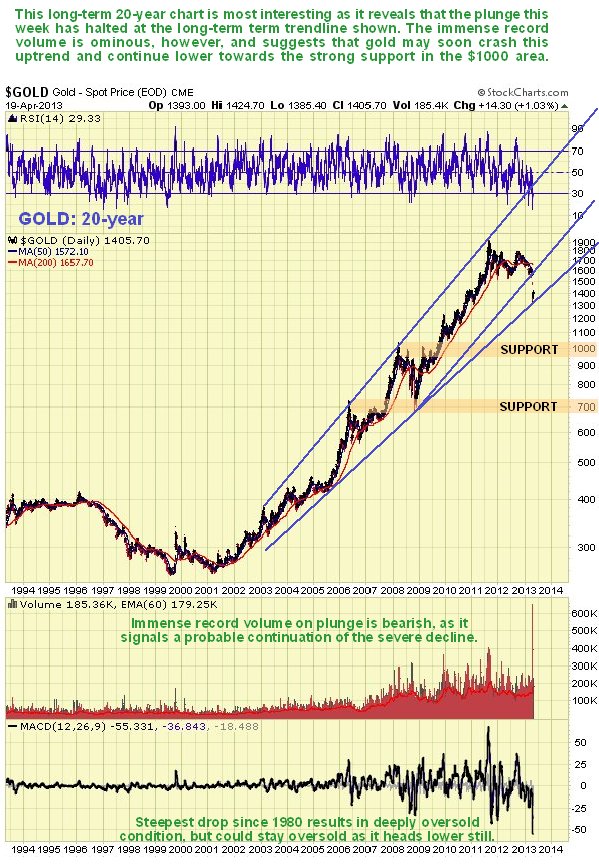
Another reason for gold's plunge to halt where it did was the fact that it had arrived at another long-term uptrend line which originated back in 2005, as we can see on gold's 20-year chart below. While going on price alone it looks like this line could hold and generate a reversal to the upside, the massive down day last Monday and enormous volume on the plunge strongly suggests that this trendline will fail and that gold will drop steeply to the $1000 support level at least.
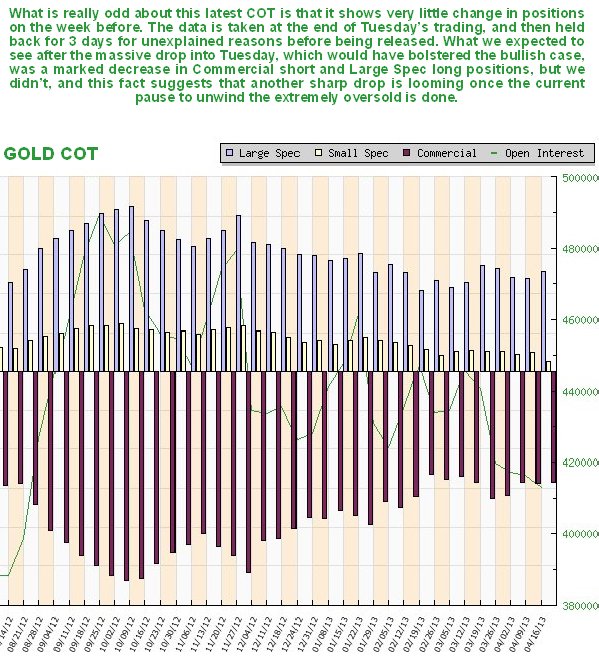
We had assumed that the huge drop on Friday - Monday and going into Tuesday would result in a significant improvement in the COT structure, as it seemed highly likely that Commercial short and Large Spec long positions would ease substantially, which would have been a positive development for bulls, but it was not to be. Instead, despite the massive drop in price, the COT structure is little changed. This is viewed as strongly bearish.
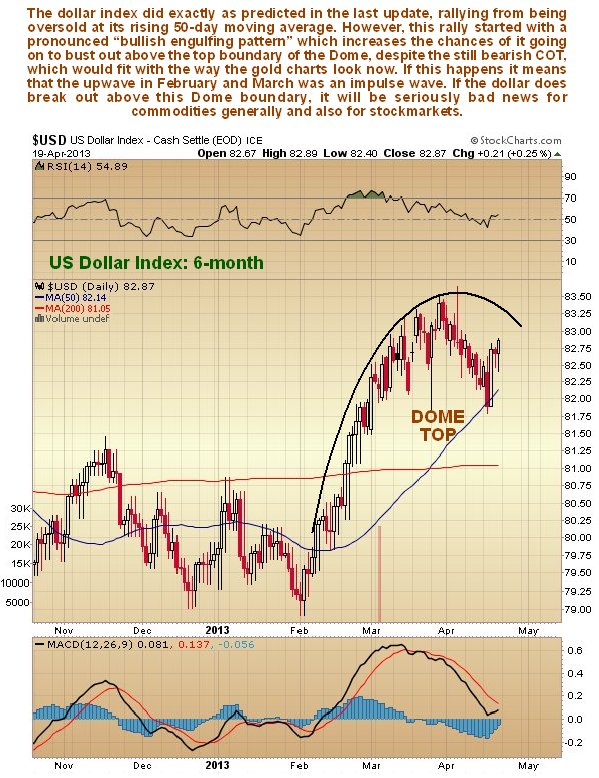
Meanwhile the dollar index rallied last week from an oversold position near to its rising 50-day moving average, as we had expected. The dollar COTs remain bearish and thus we have also been looking for a dollar rally to be contained and turned back by the Distribution Dome shown on its 6-month chart. However, the rally last week started with a quite pronounced "bullish engulfing pattern", and this fact combined with the way the gold charts look, suggests that the dollar may be starting another upleg that will break it above the Dome, which would mean that the recent reaction was just a correction to the impulse wave (move in the direction of the primary trend) that occurred in February and March. We should know quite soon as the dollar is now approaching the Dome boundary.
If gold did enter a bearmarket now, which is what the action last week appears to be signaling, it would of course have profound implications for just about everything. It may be the harbinger of an impending liquidity crunch and skyrocketing interest rates that would bring the world economy to a dead stop. Given that the debt and derivatives mess is orders of magnitude worse than in 2008, due to that which caused the problem being use to fix it, or more accurately to paper over the cracks and buy time, we could see a commodity and stockmarket meltdown that would make 2008 look like a walk in the park. Given that gold and silver have just started to crater, are there any other major warning signs flashing out there?
There are - the long-term copper chart looks absolutely terrifying. With gold's plunge on Monday last week it largely went unnoticed that copper broke down from a giant 3-year plus Head-and-Shoulders top on massive record volume. We can see this development on the 20-year copper chart below, and how this Head-and-Shoulders top forms the 2nd high of a giant Double Top whose peaks are separated by a deep ravine the deepest recesses of which lie in the 2008 crash lows. Copper is believed to be breaking down, and if it should now plunge back towards its 2008 lows, it will have the direst implications for the world economy.
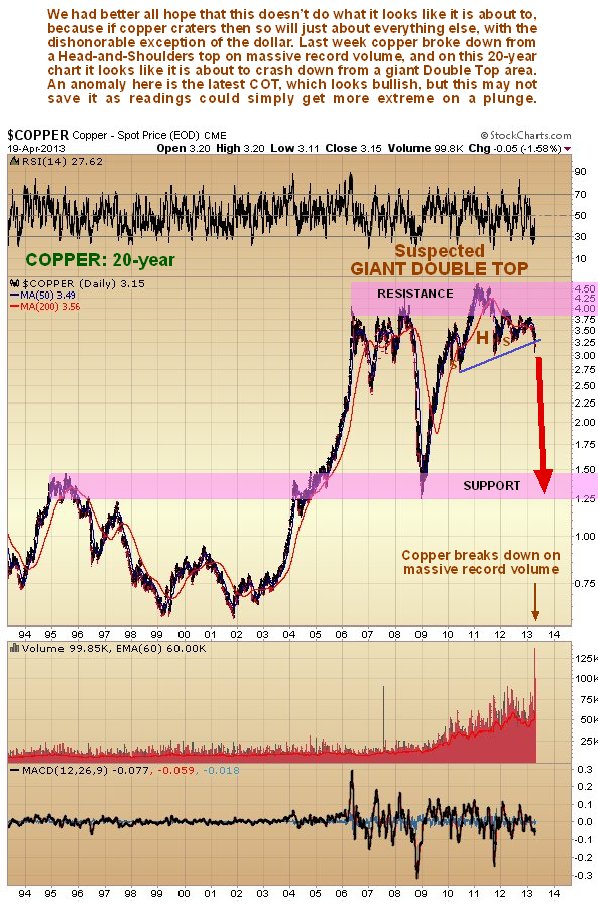
It is hard if not impossible to reconcile the latest copper COT charts with the bearish look of the copper price charts, for the latest copper COTs look strongly bullish, implying that copper will pull back from the brink and stage a rally, perhaps to drop later on. However, we should remember that the silver COTs looked bullish too, but that didn't save it from plunging.
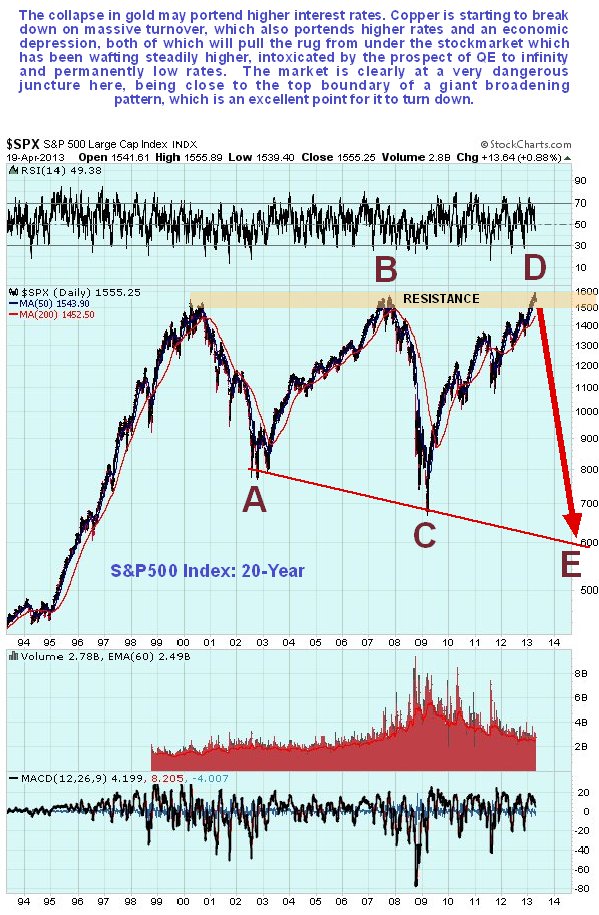
If copper follows gold into the abyss there won't be any prizes for guessing what will happen to "the market that thought it could go up forever", regardless of the state of the economy - the US stockmarket. If players gets the slightest whiff of rising interest rates, stocks will crater, as shown on our admittedly rather dramatic 20-year chart for the S&P500 index shown below. This market has been rising for a long, long time, has not got clear of the strong resistance near to the 2000 and 2007 highs, and looks set to roll over and plunge.
FWIW, The Clivester, as some of us refer to him, is usually an excellent contrary indicator. When he comes out strongly bullish or strongly bearish, he’s almost always wrong.
OTOH, the negative action since last December and the recent crash are pretty sure to take a little longer before we can make a bottom here. Maybe another month or so?
JMHO.
That my friend is why we are not all rich. Congress reset the insider trading so they can become rich. I think the gold “crash” is some rich peoples scheme to get rich.
I am not so sure about the drop in the price of copper, a few days ago the Rio Tinto mine, 20 miles southwest of Salt Lake City, Utah, had a Major cave in. The mine supplies 18% of the total copper used by the US. The mine is over 3 miles across and it will take several years to get up to peak production. Copper may be a good buy, right now.
If you are China and stuck with a bunch of green toilet paper, one strategy would be to pay off a big bank to create a dip in the commodities markets to create an opppertunity to unload some of the green toilet paper.
The other strategy for China is to blackmail other currencies to trade with you directly instead of in green toilet paper.
This is also working out well for them.
Dab nabbit now I’m gonna need to keep track of two pieces of paper.
Why? Will money in the bank no longer be at risk of Cyprussing? Will governments suddenly start living within their means? Will the dollar stop being printed into oblivion? Will Europe and Japan suddenly be fixed? Oh, well in that case, no need for gold & silver.
I have been putting off buying more silver because I have other food production system purchases higher in the priority list at this point.
This is also working out well for them.
China was going to buy 25 ton of gold I read somewhere. Why not manipulate the market to collapse the price before buying?
If GSR goes to 80:1, sell gold and buy silver. If GSR goes to 20:1, sell silver and buy gold.
Is that your personal ratio, or is there somewhere that I can look at the historic ratios?
And, I would say, leave out the “sell” part of the equation, though that would accelerate your accumulation.
FWIW, this is his short term prediction. And unless you are shorting the market, don’t look forward to a commodity crash as that will happen because it will be forecasting the world dipping back into recession.
When the DOW trades 2:1 to gold, then I will know gold is over valued.
It seems to be the general consensus on the Kitco forums.
Having other higher priorities to purchase first might be a good reason to not buy silver, but, on the other hand (and, IMHO) it dropping below $20 is not a good reason.
Disclaimer: Opinions posted on Free Republic are those of the individual posters and do not necessarily represent the opinion of Free Republic or its management. All materials posted herein are protected by copyright law and the exemption for fair use of copyrighted works.