Skip to comments.
Appalachian Mountains, Carbon Dioxide [Decrease] Caused Long-Ago Global Cooling
TerraDaily ^
| October 30, 2006
| Staff Writers
Posted on 10/30/2006 7:17:14 AM PST by cogitator
The rise of the Appalachian Mountains may have caused a major ice age approximately 450 million years ago, an Ohio State University study has found. The weathering of the mountains pulled carbon dioxide (CO2) from the atmosphere, causing the opposite of a greenhouse effect -- an "icehouse" effect.
Scientists have suspected that our current ice age, which began 40 million years ago, was caused by the rise of the Himalayas. This new study links a much earlier major ice age --one that occurred during the Ordovician period -- to the uplift of the early Appalachians .
It also reinforces the notion that CO2 levels in the atmosphere are a major driver of Earth's climate.
Seth Young, a doctoral student in earth sciences at Ohio State, reported the new study October 25 at the Geological Society of America meeting in Philadelphia.
Because we are currently living in an ice age -- or, more precisely, in a slightly warmer interglacial period within an ice age -- CO2 levels worldwide would ordinarily be low; but scientists believe that humans have raised CO2 levels by burning fossil fuels.
Matthew Saltzman, professor of geological sciences and Young's advisor, looks for evidence of ancient climate change to help scientists gain perspective on the climate change of today. He believes the geologic record can help solve current debates.
One such debate is whether atmospheric carbon dioxide truly drives Earth's climate. The planet has shifted between greenhouse conditions and icehouse conditions throughout its history, and research from Saltzman's team strongly suggests that carbon dioxide levels are a key cause.
"In this study, we're seeing remarkable evidence that suggests atmospheric CO2 levels were in fact dropping at the same time that the planet was getting colder. So this significantly reinforces the idea that CO2 is a major driver of climate," Saltzman said.
This study builds on work the same team published in 2005, when they used quartz sandstone deposits in Nevada and two sites in Europe to determine when the Ordovician ice age began -- approximately 450 million years ago.
They've now analyzed the same set of rock samples in a different way, comparing the ratio of two isotopes of the element strontium, strontium-87 and strontium-86.
They found that, immediately prior to the time that the Ordovician ice age began, the strontium ratio dropped dramatically. The likely cause: a vast amount of volcanic rock was being eroded away, and the resulting sediment was being deposited in the world oceans.
"We observed a major shift in the geochemical record, which tells us something must have changed in the oceans," Young said.
The timing of the strontium ratio decline matches the rise of the Appalachian Mountains . The crustal plate underneath what is now the Atlantic Ocean pushed against the eastern side of North America, lifting ancient volcanic rock up from the seafloor and onto the continent.
This kind of silicate rock weathers quickly, Young explained. It reacts with CO2 and water, and the rock disintegrates. Carbon from the CO2 is trapped in the resulting sediment.
The chemical reaction that weathered away part of the Appalachians would have consumed large amounts of CO2 from the atmosphere -- right around the time that the Ordovician ice age began.
The Ordovician period started out warm, with high sea levels worldwide. It ended cold, with low sea levels as glaciers covered the poles and portions of the continents. According to the Ohio State study, most of the Appalachian weathering took place over 7 or 8 million years -- a very short time, by geological standards -- as the climate moved from one extreme to the next.
The crossover between greenhouse and icehouse conditions set the stage for mass extinctions around the planet at the end of the Ordovician.
"We are seeing a mechanism that changed a greenhouse state to an icehouse state, and it's linked to the weathering of these unique volcanic rocks," Young said.
This kind of rock is often called "island arc" rock, because it forms curved chains of volcanic islands such as Indonesia and Japan.
"Those rocks are around today, where you have ocean crust being subducted under a crustal plate," Young explained. "What's unusual about the Ordovician period is that those island arcs were being uplifted onto a continent. The ones in the Pacific Ocean now are mostly underwater, so they're not weathering away like the Appalachian rock did."
The rise and subsequent weathering of the Himalayas may have caused our current ice age, the one that began 40 million years ago.
"In the Himalayas, the process would have been the same -- silicate rocks are exposed to the atmosphere, weathering sucks CO2 out of the atmosphere and chills the planet," Saltzman said.
"This may be the only effective way to bring CO2 levels down to a threshold that's cool enough for ice to start building up."
Coauthors on the study included Kenneth Foland, a professor, and Jeff Linder, a research associate, both in earth sciences at Ohio State. The National Science Foundation funded this research.
TOPICS: Education; Science
KEYWORDS: climate; globalwarming; globalwarminghoax; junkscience; mountains; ordovician; weathering
Navigation: use the links below to view more comments.
first 1-20, 21-27 next last
Good paleoclimate research.
1
posted on
10/30/2006 7:17:16 AM PST
by
cogitator
To: cogitator
If I get to choose, I choose Greenhouse over Icehouse. I would be happy to stave off the next round of glaciation if I could - guess I'll just go out and start the car and drive around all day.
To: cogitator
Good paleoclimate research.
Only if one presumes CO2 to be a driver rather than an effect of variation in global temperature, a presumption far from being supported in empericle studies.
CO2-Temperature Correlations
- "(1) correlation does not prove causation, (2) cause must precede effect, and (3) when attempting to evaluate claims of causal relationships between different parameters, it is important to have as much data as possible in order to weed out spurious correlations.
***
Consider, for example, the study of Fischer et al. (1999), who examined trends of atmospheric CO2 and air temperature derived from Antarctic ice core data that extended back in time a quarter of a million years. Over this extended period, the three most dramatic warming events experienced on earth were those associated with the terminations of the last three ice ages; and for each of these climatic transitions, earth's air temperature rose well in advance of any increase in atmospheric CO2. In fact, the air's CO2 content did not begin to rise until 400 to 1,000 years after the planet began to warm. Such findings have been corroborated by Mudelsee (2001), who examined the leads/lags of atmospheric CO2 concentration and air temperature over an even longer time period, finding that variations in atmospheric CO2 concentration lagged behind variations in air temperature by 1,300 to 5,000 years over the past 420,000 years."
[ see also: Indermuhle et al. (2000), Monnin et al. (2001), Yokoyama et al. (2000), Clark and Mix (2000) ]
- "Other studies periodically demonstrate a complete uncoupling of CO2 and temperature "
[see: Petit et al. (1999), Staufer et al. (1998), Cheddadi et al., (1998), Raymo et al., 1998, Pagani et al. (1999), Pearson and Palmer (1999), Pearson and Palmer, (2000) ]
- "Considered in their entirety, these several results present a truly chaotic picture with respect to any possible effect that variations in atmospheric CO2 concentration may have on global temperature. Clearly, atmospheric CO2 is not the all-important driver of global climate change the climate alarmists make it out to be."
Global warming and global dioxide emission and concentration:
a Granger causality analysis
http://isi-eh.usc.es/trabajos/122_41_fullpaper.pdf
- "We find, in opposition to previous studies, that there is no evidence of Granger causality from global carbon dioxide emission to global surface temperature. Further, we could not find robust empirical evidence for the causal nexus from global carbon dioxide concentration to global surface temperature."
It behooves one to look at the total picture where paleoclimate research is concerned.
|
Global Surface Temperature and Atmospheric CO2 over Geologic Time 
Late Carboniferous to Early Permian time (315 mya -- 270 mya) is the only time period in the last 600 million years when both atmospheric CO2 and temperatures were as low as they are today (Quaternary Period ). Temperature after C.R. Scotese
CO2 after R.A. Berner, 1994
- There has historically been much more CO2 in our atmosphere than exists today. For example, during the Jurassic Period (200 mya), average CO2 concentrations were about 900 ppm or about 2.5 times higher than today. The highest concentrations of CO2 during all of the Paleozoic Era occurred during the Ordovician Period, exceeding 6000 ppm -- more than 16 times higher than today.
- The Carboniferous Period and the Ordovician Period were the only geological periods during the Paleozoic Era when global temperatures were as low as they are today.
To the consternation of global warming proponents, the Late Ordovician Period was also an Ice Age, with CO2 concentrations nearly 15 times higher than today-- 5500 ppm. According to greenhouse theory, Earth should have been exceedingly hot. Instead, global temperatures were no warmer than today. Clearly, other factors besides atmospheric carbon influence earth temperatures and global warming.
|
3
posted on
10/30/2006 8:35:21 AM PST
by
ancient_geezer
(Don't reform it, Replace it.)
To: ancient_geezer
Seems mostly speculative to me.
4
posted on
10/30/2006 9:04:01 AM PST
by
ClaireSolt
(Have you have gotten mixed up in a mish-masher?)
To: ancient_geezer
Only if one presumes CO2 to be a driver rather than an effect of variation in global temperature,That's what the research is about, determining and evaluating atmospheric CO2 concentration as a climate change driver. Clearly the time-scales here are different that the century-scale of the current aberration.
I hope that your wife is doing better.
5
posted on
10/30/2006 9:04:50 AM PST
by
cogitator
To: cogitator
That's what the research is about, determining and evaluating atmospheric CO2 concentration as a climate change driver.
"The rise of the Appalachian Mountains may have caused a major ice age approximately 450 million years ago [Ordovician Period], an Ohio State University study has found. The weathering of the mountains pulled carbon dioxide (CO2) from the atmosphere, causing the opposite of a greenhouse effect -- an "icehouse" effect. "
Where atmospheric CO2 levels were 15 times higher than they are today.
Interesting that the Ordovician ice age dropped below 12oC temperatures. Actually below the current global mean temperature at 14oC, and was induced at levels exceeding 5500ppm, where we are worried about the world warming up for CO2 levels of 360PPM. An order of magnitude difference in CO2 levels.
Seems to be a big disconnect and yet another "scientist" riding on global warming junkscience to align his papers with the politically acceptable line to push global warming hype.
As pointed out, it behooves one to look at the total picture where paleoclimate research is concerned.
|
Global Surface Temperature and Atmospheric CO2 over Geologic Time
Late Carboniferous to Early Permian time (315 mya -- 270 mya) is the only time periods in the last 600 million years when both atmospheric CO2 and temperatures were as low as they are today (Quaternary Period ). Temperature after C.R. Scotese
CO2 after R.A. Berner, 1994
- There has historically been much more CO2 in our atmosphere than exists today. For example, during the Jurassic Period (200 mya), average CO2 concentrations were about 900 ppm or about 2.5 times higher than today. The highest concentrations of CO2 during all of the Paleozoic Era occurred during the Ordovician Period, exceeding 6000 ppm -- more than 16 times higher than today.
- The Carboniferous Period and the Ordovician Period were the only geological periods during the Paleozoic Era when global temperatures were as low as they are today.
To the consternation of global warming proponents, the Late Ordovician Period was also an Ice Age, with CO2 concentrations nearly 15 times higher than today-- 5500 ppm. According to greenhouse theory, Earth should have been exceedingly hot. Instead, global temperatures were no warmer than today. Clearly, other factors besides atmospheric carbon influence earth temperatures and global warming.
|
6
posted on
10/30/2006 10:05:33 AM PST
by
ancient_geezer
(Don't reform it, Replace it.)
To: cogitator
Clearly the time-scales here are different that the century-scale of the current aberration.
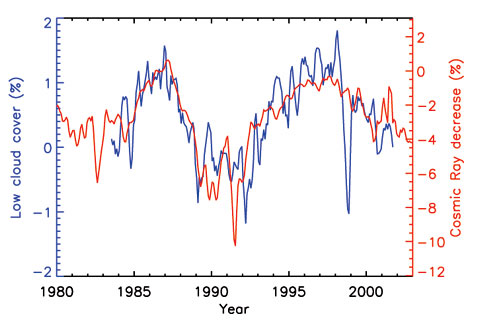
Indeed, among many other factors affecting our exceptionally warm geophysical period with current climatic temperatures predominantly driven by Solar heating/cooling arising from variation of solar activity modulating cosmic ray interactions with cloud cover:
http://spacecenter.dk/xpdf/influence-of-cosmic-rays-on-the-earth.pdf
inducing the dominant portion of global climate changes we currently experience:
Sun's Output Increasing in Possible Trend Fueling Global Warming
Sunspot Activity at 8,000-Year High
Sun's Activity Increased in Past Century, Study Confirms
New Scientist - Hyperactive sun comes out in spots

An interesting test will be on whether or not ocean and tropospheric temperatures drop as this 8000 year high in solar activity reverses as it is predicted for coming decades.
NASA - Long Range Solar Forecast

And may already be showing up in falling ocean temperatures since ~2003
Sea Change in Global Warming
with of course, additional variations in temperature due to changes in solar brightness coincident with solar activity:
http://www.telegraph.co.uk/news/main.jhtml?xml=/news/2004/07/18/wsun18.xml&sSheet=/news/2004/07/18/ixnewstop.html
supported in the warming trendsobserved throughout the solar system:
Mars warming:
http://news.bbc.co.uk/2/hi/science/nature/4266474.stm
Jupiter warming:
http://www.usatoday.com/tech/science/space/2006-05-04-jupiter-jr-spot_x.htm?POE=TECISVA
Pluto warming:
http://www.space.com/scienceastronomy/pluto_warming_021009.html
Neptune's Triton warming:
http://www.scienceagogo.com/news/19980526052143data_trunc_sys.shtml
Saturn's Enceladus warming:
http://www.sciencenewsforkids.org/articles/20060419/Feature1.asp
Saturn warming:
http://dsc.discovery.com/news/briefs/20050131/saturn.html
as well as variations in climate effects due to changess in Earth's orbital alignment with the mean solar system plane and the geophysical events affecting planetary albedo that arise from that factor:
|
Spectrum of 100-kyr glacial cycle: Orbital inclination, not eccentricity
Richard A. Muller* and Gordon J. MacDonald
Figure 2. Spectral fingerprints in the vicinity of the 100 kyr peak: (a) for data from Site 607; (b) for data of the SPECMAP stack; (c) for a model with linear response to eccentricity, calculated from the results of Quinn et al. (ref 6); (d) for the nonlinear ice-sheet model of Imbrie and Imbrie (ref 22); and (e) for a model with linear response to the inclination of the Earth's orbit (measured with respect to the invariable plane). All calculations are for the period 0-600 ka. The 100 kyr peak in the data in (a) and (b) do not fit the fingerprints from the theories (c) and (d), but are a good match to the prediction from inclination in (e). return to beginning

Far more important to our present analysis, however, is the fact that the predicted 100 kyr "eccentricity line" is actually split into 95 and 125 kyr components, in serious conflict with the single narrow line seen in the climate data. The splitting of this peak into a doublet is well known theoretically (see, e.g., ref 5), but in comparisons with data the two peaks in the eccentricity were merged into a single broad peak by the poor resolution of the Blackman-Tukey algorithm (as was done, for example, in ref 8). The single narrow peak in the climate data was likewise broadened, and it appeared to match the broad eccentricity feature. *** Figure 3. Variations of the inclination vector of the Earth's orbit. The inclination i is the angle between this vector and the vector of the reference frame; Omega is the azimuthal angle = the angle of the ascending node (in astronomical jargon).. In (A), (B), and (C) the measurements are made with respect to the zodiacal (or ecliptic) frame, i.e. the frame of the current orbit of the Earth. In (D), (E), and (F) the motion has been trasformed to the invariable frame, i.e. the frame of the total angular momentum of the solar system. Note that the primary period of oscillation in the zodiacal frame (A) is 70 kyr, but in the invariable plane (D) it is 100 kyr.
 There is evidence from the Infrared Astronomical Satellite (ref 39) of a narrow dust band extending only two degrees from the invariable plane. The precise location of these bands is uncertain; they may be orbiting in resonant lock with the Earth (ref 40, 41). It is not clear that these bands contain sufficient material to cause the observed climate effects. We note, however, that even small levels of accretion can scavenge greenhouse gases from the stratosphere, and cool the Earth's climate through the mechanism proposed by Hoyle (ref 30). The dust could also affect climate by seeding the formation of much larger ice crystals. The accreting material could be meteoric, originating as particles too large to give detectable infrared radiation.
Data on noctilucent clouds (mesospheric clouds strongly associated with the effects of high meteors and high altitude dust) supports the hypothesis that accretion increase significantly when the Earth passes through the invariable plane. As shown in Figure 6, a strong peak in the number of observed noctilucent clouds occurs on about July 9 in the northern hemisphere (ref 41, 42) within about a day of the date when the Earth passes through the invariable plane (indicated with an arrow). In the southern hemisphere the peak is approximately on January 9, also consistent with the invariable plane passage, but the data are sparse. The coincidence of the peaks of the clouds with the passage through the invariable plane had not previously been noticed, and it supports the contention that there is a peak in accretion at these times. On about the same date there is a similarly narrow peak is observed in the number of polar mesospheric clouds (ref43) and there is a broad peak in total meteoric flux (ref 44). It is therefore possible that it is the trail of meteors in the upper atmosphere, rather than dust, that is responsible for the climate effects.
Fig 6. Frequency of noctilucent clouds vs. day of year, in (A) the northern hemisphere, and in (B) the sourthern hemisphere (ref 41, 42). The arrows indicate the dates when the earth passes through the invariable plane. The coincidence of these dates with the maxima in the noctilucent clouds suggests the presence of a thin ring around the sun. Peaks on the same dates are seen in Polar mesospheric clouds (ref 44) and in radar counts of meteors. 
|
http://www.newscientistspace.com/article/dn9228-mysterious-glowing-clouds-targeted-by-nasa.html
Mysterious glowing clouds targeted by NASA
26 May, 2006

High-altitude noctilucent clouds have been mysteriously spreading around the world in recent years (Image: NASA/JSC/ES and IA)
http://newton.ex.ac.uk/aip/physnews.252.html#1
INTERPLANETARY DUST PARTICLES (IDPs) are deposited on the Earth at the rate of about 10,000 tons per year. Does this have any effect on climate? Scientists at Caltech have found that ancient samples of helium-3 (coming mostly from IDPs) in oceanic sediments exhibit a 100,000-year periodicity. The researchers assert that their data, taken along the Mid-Atlantic Ridge, support a recently enunciated idea that Earth's orbital inclination varies with a 100-kyr period; this notion in turn had been broached as an explanation for a similar periodicity in the succession of ice ages. (K.A. Farley and D.B. Patterson, Nature, 7 December 1995.)
Farley & Patterson 1998, http://www.elsevier.com/gej-ng/10/20/36/33/37/32/abstract.html
Farley http://www.gps.caltech.edu/~farley/
Farley http://www.elsevier.nl/gej-ng/10/18/23/54/21/49/abstract.html
http://www.publicaffairs.noaa.gov/pr96/dec96/noaa96-78.html
ABRUPT CLIMATE CHANGE DURING LAST GLACIAL PERIOD COULD BE TIED TO DUST-INDUCED REGIONAL WARMING
Preliminary new evidence suggests that periodic increases in atmospheric dust concentrations during the glacial periods of the last 100,000 years may have resulted in significant regional warming, and that this warming may have triggered the abrupt climatic changes observed in paleoclimate records, according to a scientist at the Commerce Department's National Oceanic and Atmospheric Administration. Current scientific thinking is that the dust concentrations contributed to global cooling.
7
posted on
10/30/2006 11:42:39 AM PST
by
ancient_geezer
(Don't reform it, Replace it.)
To: cogitator
I hope that your wife is doing better.
Quite a bit better now thank you. Home from physical therapy Friday night, getting around with a walker, and improving each day as she heals.
8
posted on
10/30/2006 11:45:37 AM PST
by
ancient_geezer
(Don't reform it, Replace it.)
To: ancient_geezer
Thanks again for the effort, and I don't think I'll revisit discussions we have had before. Regarding the "warming" of other planetary bodies, I did respond to Conservative Mind here:
http://www.freerepublic.com/focus/f-news/1727767/posts?page=50#50
with what I think is good information addressing the linkage (or lack thereof) to solar variability. While I will grant the investigation of cosmic ray influence on clouds and Earth's climate has merit, as noted in the recent post on RealClimate (including the response from one of the involved researchers, #7), considerably more work needs to be done.
Quote from response #7. "Finally an opinion of my own: Press release or not, I am in no way out to attribute what has gone on in the last century solely to cosmic rays or anything else and I am certainly not out to belittle the effect of CO2 and other greenhouse gases." (Note that there have been a lot of additional responses since last I checked this article)
Taking cosmic rays for a spin
9
posted on
10/31/2006 7:05:21 AM PST
by
cogitator
To: cogitator
"Finally an opinion of my own: Press release or not, I am in no way out to attribute what has gone on in the last century solely to cosmic rays or anything else and I am certainly not out to belittle the effect of CO2 and other greenhouse gases. To me this is simply an interesting piece of science that looks like it could be another piece of the climate puzzle. If the size of this piece is big enough to make an impact on past, present or future climate is the subject of future research."
Interesting that no one else is attributing what has gone on "solely to cosmic rays or anything else" either. Certainly all factors must be given their due, including the many factors covered in my comments which the UN/IPCC has most certainly chosen to minimize seeing as, in the words of one researcher, "All calculations about the greenhouse effect and global warming assume cloud cover isn't changing,".
In this person's opinion it would appear as though the UN/IPCC would certainly like to be able to attribute all global climate change to varitation in atmospheric CO2. However I most certainly give CO2 variation its due, (i.e.direct radiative effect of 0.2oC per each doubling of atmospheric concentration) as you well know.
"the direct radiative effects of doubled CO2 can cause a maximum surface warming [at the equator] of about 0.2 K, and hence roughly 90% of the 2.0-2.5 K surface warming obtained by the GCM is caused by atmospheric feedback processes described above."
--- "Increased Atmospheric CO2: Zonal and Seasonal Estimates of the Effect on the Radiation Energy Balance and Surface Temperature" (V. Ramanathan and M. S. Lian), J. Geophys. Res., Vol. 84, p. 4949, 1979.
I just happen to hold that other factors such as Solar activity mentioned above in #3, #6, & #7 impact earth's climate swamping out that of any very small contribution of anthropogenic CO2 accumlations in the atmosphere over natural variations due to external factors affecting cloud cover as well as direct irradiation.
While I will grant the investigation of cosmic ray influence on clouds and Earth's climate has merit, as noted in the recent post on RealClimate (including the response from one of the involved researchers, #7), considerably more work needs to be done.
Oh indeed considerable more work needs to be done, especially by the UN/IPCC global climate modelers, seeing as "All calculations about the greenhouse effect and global warming assume cloud cover isn't changing," in the words of one researcher. We must note that, obviously, not all factors are being taken into proper account where the reckoning of the the IPCC and global warming crowd is concerned.
Especially when we consider, that observed variations in cloud cover in just a five year time frame account for as much as 1.2 watts variation in Earth's surface heating. In the words of Svensmark, “That figure can be compared with about 1.4 watts per square meter estimated by the [United Nations’] Intergovernmental Panel on Climate Change for the greenhouse effect of all the increase in carbon dioxide in the air since the Industrial Revolution,”
10
posted on
10/31/2006 8:44:16 AM PST
by
ancient_geezer
(Don't reform it, Replace it.)
To: ancient_geezer
However I most certainly give CO2 variation its due, (i.e.direct radiative effect of 0.2oC per each doubling of atmospheric concentration) as you well know.Based on somewhat exhaustive Web research, the accepted direct radiative forcing from doubled CO2 is ~0.9 C. (globally). You and a couple of others attempt to distinguish between surface warming and total global warming; I can't pursue that with sufficient detail to determine if that discrimination is a valid approach.
I just happen to hold that other factors such as Solar activity mentioned above in #3, #6, & #7 impact earth's climate swamping out that of any very small contribution of anthropogenic CO2 accumlations in the atmosphere over natural variations due to external factors affecting cloud cover as well as direct irradiation.
And while we disagree on the relative sizes of each forcing, we agree that cloud effects are the dominant uncertainty (as I also agree with FR "palmer"). This agreement underscores your final comments here. The problem I perceive is that cloud cover could be a significant positive feedback, a minor positive feedback, no feedback either way, a minor negative feedback, or a significant negative feedback (and it sure would be NICE if it was the last). So a range of possibilities must be evaluated and a risk-analysis based on those possibilities must be formulated. Those who are risk-averse to the possibility of irreversible major climate effects (I put myself in that category) would favor more rapid and dramatic action than those who are less risk-averse.
To: cogitator
Based on somewhat exhaustive Web research, the accepted direct radiative forcing from doubled CO2 is ~0.9 C.
I rather doubt that, as that "~0.9 C." figure is a climate sensitivity factor assuming an aprior existance of empirically unconfirmed atmospheric feedback operating on direct radiative forcing, and is not the value of direct radiative forcing which is solely of function of the Stefan-Boltzman relation.
Given:
The temperature of the Earth's surface with an atmosphere is 288oK (+15oC).
and the blackbody temperature of the Earth without atmosphere at 254.3oK (-18.7oC)
One may apply the Stefan-Boltzman relation:
E=sT4
where:
E = total amount of radiation emitted by an object per square meter (Watts m-2)
s is a constant called the Stefan-Boltzman constant = 5.67 x 10⁻⁸ Watts m-2 K-4
T is the temperature of the object in K
to determine the total GHG direct radiative forcing necessary to maintain the atmosphere/surface greenhouse temperature at the current 288oK surface temperature of the earth.
Under constant albedo conditions (CO2 does not contribute to earth's albedo) The total flux at the Earth's troposphere/surface system due to greenhouse factors is:
Flux (E288) at the Earth's surface with atmosphere = 5.67*10-8(288oK)4 = 390.08 w/m2
Blackbody flux (E255) without atmosphere = 5.67*10-8(254.3oK)4 = 237.12 w/m2
==================================================================
difference = 152.96 wm2
Given the (natural + anthropogenic) CO2 contribution is 3.502% of total greenhouse warming. The total radiative flux expressed in the thermal heating capacities of CO2 must of necessity be less than:
0.03502*152.96 w/m2 = 5.357 wm2
However, CO2 IR flux at the surface from CO2 concentrations in the atmosphere is less than half that total CO2 contribution of 5.357wm2 for the system as a whole. More than half of CO2 radiant forcing is emitted and/or scattered by clouds & dust upward to be lost to atmospheric heating and space rather than contributing towards global warming at the surface. It must be remembered that heat flow is from hotter regions to cooler from atmosphere to to the surface. Any change at surface due to CO2 concentration must be driven by a comensurately higher temp in the atmosphere.
The amounts of direct radiative heating contributed by atmospheric CO2 used by the IPCC are allocated as follows:
Re-cycling of Infra-Red Energy
According to Dr Hugh Ellsaesser's IPCC submission, "The direct increase in radiative heating of the lower atmosphere (tropopause level) due to doubling CO2 is 4 wm-2. At the surface it is 0.5 - 1.5 wm-2". Schlesinger & Mitchell (1985), estimated this surface flux at 2 wm-2. Thus, depending on the model, or modeler, the estimates for increased surface flux following a CO2 doubling, varies between +0.5 and +2 wm-2. An above-averaged figure of +1.5 wm-2 will be assumed here for purposes of analysis and comparison.
At the current surface temperature (288oK) Doubling the atmospheric CO2 concentration from 340ppmv can only add 1.5w/m2 at the surface for a total surface radiative forcing of
390.08+1.5 = 391.58wm2
providing a maximum
(391.58/5.67*10-8)0.25-288oK = 0.277oK (C)increase in surface temperature for a doubling of atmospheric CO2 concentration.
Q.E.D:
"the direct radiative effects of doubled CO2 can cause a maximum surface warming [at the equator] of about 0.2 K, and hence roughly 90% of the 2.0-2.5 K surface warming obtained by the GCM is caused by atmospheric feedback processes described above."
--- "Increased Atmospheric CO2: Zonal and Seasonal Estimates of the Effect on the Radiation Energy Balance and Surface Temperature" (V. Ramanathan and M. S. Lian), J. Geophys. Res., Vol. 84, p. 4949, 1979.
And while we disagree on the relative sizes of each forcing, we agree that cloud effects are the dominant uncertainty (as I also agree with FR "palmer").
That's good of you especially considering that the UN/IPCC modellers consider cloud cover to be unchanging and not a forcing at all.
The problem I perceive is that cloud cover could be a significant positive feedback, a minor positive feedback, no feedback either way, a minor negative feedback, or a significant negative feedback (and it sure would be NICE if it was the last).
Certainly a consideration which just underscores that the atmospheric feedbacks on which that 0.9oC climate sensitivity factor you have quoted is rooted in is essentially a WAG with no empirical confirmation.
The "feedback" in thermal terms is not the issue in what the Svensmark research is indicating. Cloud cover variation due to modulation of cosmic ray flux is an induced external factor not a thermal feed back.
In point of fact any thermal feedback in operation would multiply the thermal effects due to cloud cover variation in just the same operating modes and to the same degree as is presumed to be acting on CO2 induced thermal increases. Heat is heat regardless of what it is attributed to. 1watt per square meter change in CO2 forcing at the surface is just the same as 1 watt per square meter change at the surface from thermal forcing due to varitation in cloud cover.
So a range of possibilities must be evaluated and a risk-analysis based on those possibilities must be formulated. Those who are risk-averse to the possibility of irreversible major climate effects (I put myself in that category) would favor more rapid and dramatic action than those who are less risk-averse.
Tell me does that risk assessment factor and risk-aversion include the risk of no essential result in whatever costly "rapid and dramatic action" you would impress upon the rest of us? In fact does that risk assessment factor include that anything done to decrease warming operates against those natural factors in the works headed in the the opposite direction?
I for one expect that mankind has much more to worry about in adjusting to ice-ages than it does in any global warming scenario under the current geophysical factors in place limiting warming that this Earth may undergo in the geological short term.
12
posted on
10/31/2006 10:18:36 AM PST
by
ancient_geezer
(Don't reform it, Replace it.)
To: cogitator
Based on somewhat exhaustive Web research, the accepted direct radiative forcing from doubled CO2 is ~0.9 C.
Since the forcing from doubled CO2 is about 1.5 watts per square meter surface thermal flux at the surface according to UN/IPCC global climate modelers. That would be about 0.9C climate sensitivity per 1.5 watts per square meter change in thermal forcings.
Re-cycling of Infra-Red Energy
According to Dr Hugh Ellsaesser's IPCC submission, "The direct increase in radiative heating of the lower atmosphere (tropopause level) due to doubling CO2 is 4 wm-2. At the surface it is 0.5 - 1.5 wm-2". Schlesinger & Mitchell (1985), estimated this surface flux at 2 wm-2. Thus, depending on the model, or modeler, the estimates for increased surface flux following a CO2 doubling, varies between +0.5 and +2 wm-2. An above-averaged figure of +1.5 wm-2 will be assumed here for purposes of analysis and comparison.
The observed variation of lower level cloud cover effects a 1.4 watt per meter change in surface thermal flux across a five year period of 2% clearly as a result of cosmic ray modulation.
The UN/IPCC assigns 1.5 watts to CO2 doubling rather than lower cloud cover variation which it presumes to be zero change in its models.
Hmm doesn't leave much in the Earth's radiative balance for CO2 increases, taking into account the effects of changing solar activity throughout the period since the industrial revolution does it?
Looks like the UN/IPCC modelers have a lot of reprogramming adjusting for solar activity effects on cloud cover to rebalance the thermal factors to me.
13
posted on
10/31/2006 10:51:17 AM PST
by
ancient_geezer
(Don't reform it, Replace it.)
To: ancient_geezer
My, you're talkative today.
I rather doubt that, as that "~0.9 C." figure is a climate sensitivity factor assuming an aprior existance of empirically unconfirmed atmospheric feedback operating on direct radiative forcing, and is not the value of direct radiative forcing which is solely of function of the Stefan-Boltzman relation.
No, it's not. 0.9 C is from the Stefan-Boltzmann relationship; that's how I found it.
650,000 years of greenhouse gas concentrations
Read response #85 in the comments (which responds to earlier comments 51, 57, 79, and 83). If you think this is wrong, take it up with the author of the posting, not me. As I said, you're distinguishing between the surface radiative forcing and the global radiative forcing. We've been over this before. The difference is the usage of 4 w m-2 forcing vs. 1.5 w m-2 forcing. (I have never determined if Ellsaesser's "submission" was used by the IPCC.)
That's good of you especially considering that the UN/IPCC modellers consider cloud cover to be unchanging and not a forcing at all.
I replied to you about this already. There are no "UN/IPCC modelers". Cloud cover is not a forcing, it's a feedback.
Certainly a consideration which just underscores that the atmospheric feedbacks on which that 0.9oC climate sensitivity factor you have quoted is rooted in is essentially a WAG with no empirical confirmation.
Again, this is inaccurate. It's certainly not a WAG.
The "feedback" in thermal terms is not the issue in what the Svensmark research is indicating. Cloud cover variation due to modulation of cosmic ray flux is an induced external factor not a thermal feed back.
OK, I understand your point. There is a long way to go to demonstrate conclusively that this process is a significant factor in climate. I.e., steps 1-5 as described in RealClimate.
Tell me does that risk assessment factor and risk-aversion include the risk of no essential result in whatever costly "rapid and dramatic action" you would impress upon the rest of us? In fact does that risk assessment factor include that anything done to decrease warming operates against those natural factors in the works headed in the the opposite direction?
Good question. As you might perceive, I am in agreement with the current scientific understanding of climate change. Because our nation's (and the Western world's) fossil fuel energy dependence is critical to the economy and national security, my choice of preferred action is one that shifts us to alternate sources of energy with a correspondingly reduced climate impact. I believe that this is the best course of action, and will yield the most benefits for the economy, national security, and the environment. I believe that there is sufficient justification (on multiple fronts) to pursue this course of action while climate change science addresses the current uncertainties.
I for one expect that mankind has much more to worry about in adjusting to ice-ages than it does in any global warming scenario under the current geophysical factors in place limiting warming that this Earth may undergo in the geological short term.
I don't share that concern. On the basis of Milankovitch forcing factors, the next Ice Age is not expected to commence for about 50,000 years. Increased atmospheric CO2 concentrations are expected to enhance/prolong the interglacial conditions.
References: CO2 and astronomical forcing of the late Quaternary
An exceptionally long interglacial ahead? (Science, subscription required)
I'm more concerned about the short-term.
To: ancient_geezer
AG, two things. One, there are
no "UN/IPCC modelers". I don't know if you're using this phrase out of habit or continuing to use it just to annoy me. Two,
Ellsaesser is not a "UN/IPCC modeler", nor is he a Contributing IPCC author. His submission (as far as I can determine) was an unsolicited comment. My interpretation is based on this:
An Independent Review of the IPCC’s Third Assessment Report
My guess is that the late John Daly quotes from something Ellsaesser sent him.
The UN/IPCC assigns 1.5 watts to CO2 doubling rather than lower cloud cover variation which it presumes to be zero change in its models.
Not from what I can determine. Ellsaesser's submission does this.
Hmm doesn't leave much in the Earth's radiative balance for CO2 increases, taking into account the effects of changing solar activity throughout the period since the industrial revolution does it? ... Looks like the UN/IPCC modelers have a lot of reprogramming adjusting for solar activity effects on cloud cover to rebalance the thermal factors to me.
Your logical conclusion here is based on an inaccurate starting premise (i.e., the IPCC has not published what you are asserting it has published), and therefore the conclusion is not supported.
To: cogitator
No, it's not. 0.9 C is from the Stefan-Boltzmann relationship; that's how I found it.
Ahh, the top of the troposphere effective value that some folks use, that does not take surface albedo (i.e. surface reflection) nor does it take IR re-radiation upward into account.
In fact that flux measure is an effective value for computational purposes only (an equivalency with solar radiation intercepted by the earth.) Since CO2 is mixed throughout the atmosphere acting as a sink for IR re-radiating both upward and downward toward the suface from the atmosphere after being generated at the surface converted from visible solar radiation, and not an external source of IR in space radiating downward from the top of the atmosphere.
The IR value at the surface of 0.2oC for each doubling of CO2 concentration in the atmosphere is for the hypothesized 1.5 watts increase in surface IR flux hypothesized for CO2. Not the approximately theoretical 4 watts generally calculated as an value applied the top of the troposphere as an effective flux externally applied downward for CO2.
I suggest if you are going to look at the effect on surface tempertures, which supposedly is the value of concern in global warming effects on the Earth's surface, you should use the surface flux measure, not the top of atmosphere measure that does not implement albedo nor the re-radiation of thermal radiation upward.
Refer to #12 for the at the surface measure of 0.2oC direct radiative effects on Earth's surface temperature which is what the concern is really about as regards the hypothetical "Global Warming" effects like melting icecaps, warming oceans, extermination of species, coastal flooding wiping out population centers, destruction of mankind with massive hurricanes and violent weather from surface heating, etc. ...
16
posted on
10/31/2006 11:40:26 AM PST
by
ancient_geezer
(Don't reform it, Replace it.)
To: ancient_geezer
Your comments have merit here. I did a little searching and found this:
4: Rethinking the Global Radiative Forcing Concept (Chapter 4 from the online National Academies Press book Radiative Forcing of Climate Change: Expanding the Concept and Addressing Uncertainties (2005)
The chart on page 88 is impressive. And it shows for CO2 that if the tropopause forcing is 1 W m-2, that the surface forcing for CO2 can range from 0.38 to 1.12 W m-2. So if both factors are multiplied by 4 for doubled CO2 (giving 4 W m-2 at the tropopause), then the surface forcing can range from ~1.6 (your preferred value) to 4.48 W m-2. Correct? This shows the wide range of uncertainties.
You might comment on the section beginning on page 89, "Global mean radiative forcing at the surface".
To: cogitator
On the basis of Milankovitch forcing factors, the next Ice Age is not expected to commence for about 50,000 years.
There are of course many unanswered problems with the Milankovich forcing factors, most of which are related to the fact that those factors are out of phase with actual ice ages, with insufficient variation in radiant flux to account for ice ages and only have a frequency similar to more significant orbital parameters which are in appropriate phase as well as being much closer in cyclical period to the observed ~100k deep ice age cycle.
It is not suprizing at all that Milankovitch factors are not expected to initate another ice age, they are simply based a wrong assumption that eccentricity and variation in distance from the sun is the driver to begin with.
You and the UN/IPCC modelers really should start paying attention to what the astro and geophysics are trying to tell you. Unfortunately the "not invented here" syndrome seem to be operating overtime while climate change hypothesis are concerned.
A little review of the problems involved with the Milankovich forcing factors and a long over due but very necessary relook at the basics.
|
Spectrum of 100-kyr glacial cycle: Orbital inclination, not eccentricity
Richard A. Muller* and Gordon J. MacDonald
Figure 2. Spectral fingerprints in the vicinity of the 100 kyr peak: (a) for data from Site 607; (b) for data of the SPECMAP stack; (c) for a model with linear response to eccentricity, calculated from the results of Quinn et al. (ref 6); (d) for the nonlinear ice-sheet model of Imbrie and Imbrie (ref 22); and (e) for a model with linear response to the inclination of the Earth's orbit (measured with respect to the invariable plane). All calculations are for the period 0-600 ka. The 100 kyr peak in the data in (a) and (b) do not fit the fingerprints from the theories (c) and (d), but are a good match to the prediction from inclination in (e). return to beginning
Far more important to our present analysis, however, is the fact that the predicted 100 kyr "eccentricity line" is actually split into 95 and 125 kyr components, in serious conflict with the single narrow line seen in the climate data. The splitting of this peak into a doublet is well known theoretically (see, e.g., ref 5), but in comparisons with data the two peaks in the eccentricity were merged into a single broad peak by the poor resolution of the Blackman-Tukey algorithm (as was done, for example, in ref 8). The single narrow peak in the climate data was likewise broadened, and it appeared to match the broad eccentricity feature. *** Figure 3. Variations of the inclination vector of the Earth's orbit. The inclination i is the angle between this vector and the vector of the reference frame; Omega is the azimuthal angle = the angle of the ascending node (in astronomical jargon).. In (A), (B), and (C) the measurements are made with respect to the zodiacal (or ecliptic) frame, i.e. the frame of the current orbit of the Earth. In (D), (E), and (F) the motion has been trasformed to the invariable frame, i.e. the frame of the total angular momentum of the solar system. Note that the primary period of oscillation in the zodiacal frame (A) is 70 kyr, but in the invariable plane (D) it is 100 kyr.
There is evidence from the Infrared Astronomical Satellite (ref 39) of a narrow dust band extending only two degrees from the invariable plane. The precise location of these bands is uncertain; they may be orbiting in resonant lock with the Earth (ref 40, 41). It is not clear that these bands contain sufficient material to cause the observed climate effects. We note, however, that even small levels of accretion can scavenge greenhouse gases from the stratosphere, and cool the Earth's climate through the mechanism proposed by Hoyle (ref 30). The dust could also affect climate by seeding the formation of much larger ice crystals. The accreting material could be meteoric, originating as particles too large to give detectable infrared radiation.
Data on noctilucent clouds (mesospheric clouds strongly associated with the effects of high meteors and high altitude dust) supports the hypothesis that accretion increase significantly when the Earth passes through the invariable plane. As shown in Figure 6, a strong peak in the number of observed noctilucent clouds occurs on about July 9 in the northern hemisphere (ref 41, 42) within about a day of the date when the Earth passes through the invariable plane (indicated with an arrow). In the southern hemisphere the peak is approximately on January 9, also consistent with the invariable plane passage, but the data are sparse. The coincidence of the peaks of the clouds with the passage through the invariable plane had not previously been noticed, and it supports the contention that there is a peak in accretion at these times. On about the same date there is a similarly narrow peak is observed in the number of polar mesospheric clouds (ref43) and there is a broad peak in total meteoric flux (ref 44). It is therefore possible that it is the trail of meteors in the upper atmosphere, rather than dust, that is responsible for the climate effects.
Fig 6. Frequency of noctilucent clouds vs. day of year, in (A) the northern hemisphere, and in (B) the sourthern hemisphere (ref 41, 42). The arrows indicate the dates when the earth passes through the invariable plane. The coincidence of these dates with the maxima in the noctilucent clouds suggests the presence of a thin ring around the sun. Peaks on the same dates are seen in Polar mesospheric clouds (ref 44) and in radar counts of meteors.
|
http://www.newscientistspace.com/article/dn9228-mysterious-glowing-clouds-targeted-by-nasa.html
Mysterious glowing clouds targeted by NASA
26 May, 2006
High-altitude noctilucent clouds have been mysteriously spreading around the world in recent years (Image: NASA/JSC/ES and IA)
http://newton.ex.ac.uk/aip/physnews.252.html#1
INTERPLANETARY DUST PARTICLES (IDPs) are deposited on the Earth at the rate of about 10,000 tons per year. Does this have any effect on climate? Scientists at Caltech have found that ancient samples of helium-3 (coming mostly from IDPs) in oceanic sediments exhibit a 100,000-year periodicity. The researchers assert that their data, taken along the Mid-Atlantic Ridge, support a recently enunciated idea that Earth's orbital inclination varies with a 100-kyr period; this notion in turn had been broached as an explanation for a similar periodicity in the succession of ice ages. (K.A. Farley and D.B. Patterson, Nature, 7 December 1995.)
Farley & Patterson 1998, http://www.elsevier.com/gej-ng/10/20/36/33/37/32/abstract.html
Farley http://www.gps.caltech.edu/~farley/
Farley http://www.elsevier.nl/gej-ng/10/18/23/54/21/49/abstract.html
http://www.publicaffairs.noaa.gov/pr96/dec96/noaa96-78.html
ABRUPT CLIMATE CHANGE DURING LAST GLACIAL PERIOD COULD BE TIED TO DUST-INDUCED REGIONAL WARMING
Preliminary new evidence suggests that periodic increases in atmospheric dust concentrations during the glacial periods of the last 100,000 years may have resulted in significant regional warming, and that this warming may have triggered the abrupt climatic changes observed in paleoclimate records, according to a scientist at the Commerce Department's National Oceanic and Atmospheric Administration. Current scientific thinking is that the dust concentrations contributed to global cooling.
Increased atmospheric CO2 concentrations are expected to enhance/prolong the interglacial conditions.
LOL, and you call attempting to reverse that trend the least risky in your view? That certainly is not my assessment of the situation.
Because our nation's (and the Western world's) fossil fuel energy dependence is critical to the economy and national security, my choice of preferred action is one that shifts us to alternate sources of energy with a correspondingly reduced climate impact. I believe that this is the best course of action, and will yield the most benefits for the economy, national security, and the environment. I believe that there is sufficient justification (on multiple fronts) to pursue this course of action while climate change science addresses the current uncertainties.
Hyping global warming and very ill understood and ill based non-science is hardly conducive to achieving such goals, infact can be quite counter productive in terms of actually turning good science and good policy away for lack of credibility in the "Global Warming" alarmists camp.
If your concerns are actually "our nation's (and the Western world's) fossil fuel energy dependence is critical to the economy and national security," that concern I can share and work toward correcting such through utilization of real energy alternatives such as nuclear power taking the place of fossil fuel energy dependence. In fact such can be supported without any hype from the global warming, world crisis folks of the UN.
I wholly subscribe to the idea that nuclear energy should have been implemented yesterday, and lacking such having been done, it is all the more important to do so now to relieve our dependancing on foreign sources of fossil fuels which impact both our economy and security in our dependance of foreign souces. In the mean time, until broad implementation of nuclear power can be brought on line, we should be turning to alternatives to or current sources of fuel for maintaining and growing our economy in shale oil, oil sand technologies as well as developing our Alaskan and offshore resouces of oil and gas. Going domestic should be the primary goal for the economy as well as national security.
Global Warming hype through the UN/IPCC however is not the way to achieve either of the above for the reasons stated as well as many others involving national sovereignty and independance from foreign entanglements and global government generally.
18
posted on
10/31/2006 12:12:10 PM PST
by
ancient_geezer
(Don't reform it, Replace it.)
To: cogitator
The chart on page 88 is impressive. And it shows for CO2 that if the tropopause forcing is 1 W m-2, that the surface forcing for CO2 can range from 0.38 to 1.12 W m-2. So if both factors are multiplied by 4 for doubled CO2 (giving 4 W m-2 at the tropopause), then the surface forcing can range from ~1.6 (your preferred value) to 4.48 W m-2. Correct?
Actually that "preferred value" is merely the middle of the road figure of model outputs by the UN/IPCC modeling efforts and certainly not "my" preferred value. Taking modulation of cloud cover by cosmic ray fluctuations into account, the actuall figure would probably be closer to 0.1 watts per square meter for the thermal effects of CO2 doubling at the surface.
This shows the wide range of uncertainties.
Indeed a wide range of uncertainties, especially considering the above do not even adjust for changes in cloud cover due to solar activity as a factor to be considered in the mix.
then the surface forcing can range from ~1.6 (your preferred value) to 4.48 W m-2. Correct?
Something closer to 0.1 watt per square meter for CO2 doubling after accounting for all solar and orbit related factors in the Earth's radiation balance would be the value I would expect to ultimately wash out once the debate is actually settled with science rather than hyperbole and alarmist activism.
19
posted on
10/31/2006 12:24:44 PM PST
by
ancient_geezer
(Don't reform it, Replace it.)
To: cogitator
You might comment on the section beginning on page 89, "Global mean radiative forcing at the surface".
Looks to me that India and the Asia economies have a bit to do in reducing their Black Carbon emmissions.
Course the other half is gonna get ya too: Biology News: Clear skies end global dimming LOL
Seems no matter what, them global warming alarmists have that ever upward death spiral of theirs to support.
20
posted on
10/31/2006 12:46:44 PM PST
by
ancient_geezer
(Don't reform it, Replace it.)
Navigation: use the links below to view more comments.
first 1-20, 21-27 next last
Disclaimer:
Opinions posted on Free Republic are those of the individual
posters and do not necessarily represent the opinion of Free Republic or its
management. All materials posted herein are protected by copyright law and the
exemption for fair use of copyrighted works.
FreeRepublic.com is powered by software copyright 2000-2008 John Robinson


