Posted on 09/20/2021 4:26:29 PM PDT by kiryandil
If you've ever seen the movie Independence Day - I've developed a vote fraud theory called "the Mothership theory".
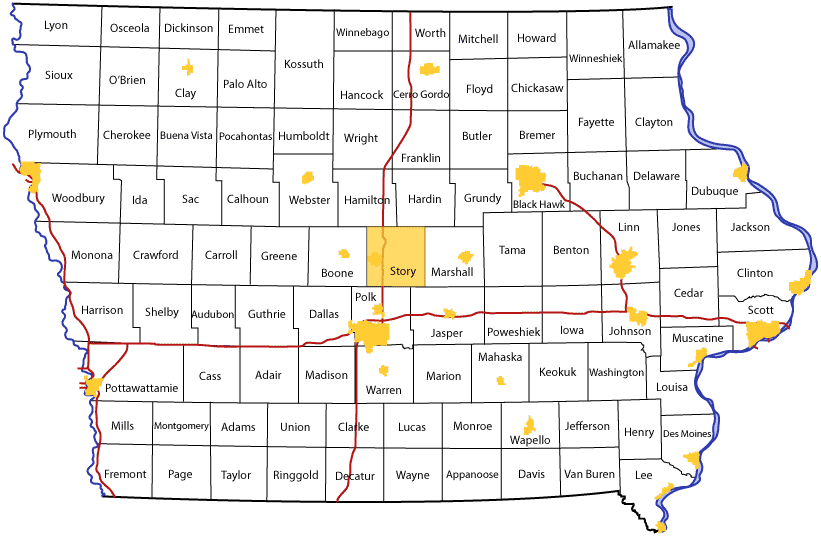
Basically, a Mothership parked over an urban area "controls" a number of counties surrounding the Mothership county.
One can see the outlines of these controlled areas by comparing the 2008 election by county with the 2020 election by county.
Remember - Zero in 2008 was the Second Coming. People, even nominal Republicans, fell all over themselves to vote for the "first black president".
He set records.
You can see the remains of the record-setting Obama votes of 2008 in 2020 in counties not controlled by the Motherships [command and control centers for vote fraud].
A spreadsheet takes about a half hour, then you print a state map by county.
Lastly, you use Wikipedia to locate the Metropolitan Statistical Areas (MSAs), which list the counties in each MSA.
Then you just compare. You can see it like a neon light.
													               2008 total Obama 2008
					         2008						         2020	       minus	  minus
		Obama 2008	McCain	 	 total			Biden 2020		Trump	 total	       2020 total Biden 2020
Adair	        47.50%	  1,924	50.80%	 2,060	  4,053	Adair	        28.68%	  1,198	69.83%	 2,917    4,177		   -124	    726
Adams	        50.20%	  1,118	46.90%	 1,046	  2,228	Adams	        27.31%	    590	70.83%   1,530	  2,160		     68	    528
Allamakee	56.10%	  3,971	41.90%	 2,965	  7,076	Allamakee	34.71%	  2,576	63.80%	 4,735	  7,422		   -346	  1,395
Appanoose	48.10%	  2,970	49.90%	 3,086	  6,179	Appanoose	29.02%	  1,891	69.24%	 4,512	  6,516		   -337	  1,079
Audubon	        50.10%	  1,739	47.10%	 1,634	  3,468	Audubon  	31.32%	  1,071	67.11%	 2,295	  3,420		     48	    668
Benton	        51.30%	  7,058	46.80%	 6,447	 13,769	Benton	        35.24%	  5,160	62.75%	 9,188	 14,642		   -873	  1,898
Black Hawk	60.20%	 39,184	37.90%	24,662	 65,060	Black Hawk	53.53%	 35,647	44.51%	29,640	 66,593		 -1,533	  3,537
Boone	        52.50%	  7,356	44.90%	 6,293	 14,011	Boone   	41.09%	  6,303	56.68%	 8,695	 15,340		 -1,329	  1,053
Bremer	        53.80%	  6,940	44.50%	 5,741	 12,908	Bremer  	40.96%	  5,958	57.02%	 8,294	 14,546		 -1,638	    982
Buchanan	58.40%	  6,050	40.00%	 4,139	 10,354	Buchanan	38.70%	  4,169	59.59%	 6,420	 10,774		   -420	  1,881
Buena Vista	47.90%	  4,075	49.70%	 4,223	  8,501	Buena Vista	36.26%	  2,961	61.91%	 5,056	  8,167		    334	  1,114
Butler	        46.70%	  3,364	51.40%	 3,700	  7,204	Butler  	29.93%	  2,424	68.44%	 5,542	  8,098		   -894	    940
Calhoun	        44.70%	  2,341	52.40%	 2,741	  5,233	Calhoun         27.96%	  1,470	70.16%	 3,689	  5,258		    -25     871
Carroll	        50.50%	  5,302	46.90%	 4,922	 10,494	Carroll 	30.47%	  3,454	68.26%	 7,737	 11,335		   -841	  1,848
Cass	        43.30%	  3,211	54.00%	 4,006	  7,412	Cass    	30.25%	  2,201	68.29%	 4,969	  7,276		    136	  1,010
Cedar	        53.80%	  5,221	44.20%	 4,289	  9,712	Cedar   	40.52%	  4,337	57.56%	 6,161	 10,703		   -991	    884
Cerro Gordo	59.30%	 14,405	38.60%	 9,375	 24,293	Cerro Gordo	45.97%	 10,941	52.28%	12,442	 23,801		    492	  3,464
Cherokee	45.40%	  2,890	53.00%	 3,372	  6,368	Cherokee	29.70%	  1,936	68.96%	 4,495	  6,518		   -150	    954
Chickasaw	59.10%	  3,923	38.50%	 2,557	  6,641	Chickasaw	33.68%	  2,233	64.97%	 4,308	  6,631		     10	  1,690
Clarke	        49.80%	  2,218	47.50%	 2,118	  4,455	Clarke  	31.39%	  1,466	67.32%	 3,144	  4,670		   -215	    752
Clay	        46.50%	  3,925	51.60%	 4,355	  8,442	Clay    	29.68%	  2,662	68.42%	 6,137	  8,969		   -527	  1,263
Clayton	        57.80%	  5,195	40.60%	 3,651	  8,990	Clayton 	34.81%	  3,340	63.64%	 6,106	  9,594		   -604	  1,855
Clinton	        60.40%	 15,018	37.50%	 9,324	 24,875	Clinton 	43.81%	 10,812	54.13%	13,361	 24,681		    194	  4,206
Crawford	51.00%	  3,715	45.90%	 3,345	  7,290	Crawford	31.03%	  2,220	67.85%	 4,854	  7,154		    136	  1,495
Dallas	        46.20%	 15,149	51.80%	16,954	 32,759	Dallas  	47.98%	 26,879	49.96%	27,987	 56,022		-23,263	-11,730
Davis	        44.00%	  1,680	53.10%	 2,029	  3,818	Davis   	24.70%	  1,013	73.92%	 3,032	  4,102		   -284	    667
Decatur	        48.40%	  1,986	49.20%	 2,020	  4,106	Decatur 	29.44%	  1,120	68.74%	 2,615	  3,804		    302	    866
Delaware	52.20%	  4,649	46.20%	 4,113	  8,903	Delaware	31.56%	  3,157	66.64%	 6,666	 10,003		 -1,100	  1,492
Des Moines	60.20%	 12,462	37.30%	 7,721	 20,693	Des Moines	44.56%	  8,893	53.08%	10,592	 19,956		    737	  3,569
Dickinson	46.50%	  4,625	51.90%	 5,162	  9,942	Dickinson	32.56%	  3,661	66.15%	 7,438	 11,244		 -1,302	    964
Dubuque	        59.30%	 28,611	38.70%	18,651	 48,255	Dubuque 	47.58%	 25,657	50.47%	27,214	 53,926		 -5,671	  2,954
Emmet	        50.60%	  2,570	46.70%	 2,373	  5,078	Emmet   	31.32%	  1,520	67.28%	 3,265	  4,853		    225	  1,050
Fayette	        57.10%	  5,908	40.70%	 4,205	 10,340	Fayette 	37.65%	  3,835	60.33%	 6,145	 10,186		    154	  2,073
Floyd	        59.00%	  4,822	37.30%	 3,051	  8,177	Floyd   	39.49%	  3,172	58.91%	 4,732	  8,032		    145	  1,650
Franklin	49.40%	  2,575	48.00%	 2,501	  5,208	Franklin	31.70%	  1,626	66.71%	 3,422	  5,130		     78	    949
Fremont	        46.90%	  1,848	50.50%	 1,989	  3,941	Fremont 	28.00%	  1,080	70.29%	 2,711	  3,857		     84	    768
Greene	        48.80%	  2,371	48.40%	 2,349	  4,858	Greene  	34.98%	  1,769	63.73%	 3,223	  5,057		   -199	    602
Grundy	        40.50%	  2,790	57.30%	 3,945	  6,890	Grundy  	30.32%	  2,206	67.74%	 4,929	  7,276		   -386	    584
Guthrie	        44.80%	  2,625	52.50%	 3,074    5,858	Guthrie 	31.16%	  1,985	67.05%	 4,272	  6,371		   -513	    640
Hamilton	49.30%	  4,018	48.00%	 3,913	  8,144	Hamilton	35.79%	  2,843	62.39%	 4,956	  7,943		    201	  1,175
Hancock	        46.90%	  2,805	50.40%	 3,016	  5,983	Hancock 	27.27%	  1,683	71.13%	 4,390	  6,172		   -189	  1,122
Hardin	        49.10%	  4,393	48.20%	 4,315	  8,956	Hardin  	33.11%	  2,976	65.08%	 5,850	  8,989		    -33	  1,417
Harrison	46.50%	  3,555	51.20%	 3,909	  7,637	Harrison	29.92%	  2,440	68.29%	 5,569	  8,155		   -518	  1,115
Henry	        46.10%	  4,349	51.20%	 4,822	  9,426	Henry   	32.81%	  3,275	65.19%	 6,507	  9,982		   -556	  1,074
Howard	        62.20%	  2,941	36.40%	 1,722	  4,729	Howard  	35.74%	  1,772	63.07%	 3,127	  4,958		   -229	  1,169
Humboldt	42.10%	  2,160	56.40%	 2,895	  5,136	Humboldt	27.07%	  1,442	71.69%	 3,819	  5,327		   -191	    718
Ida	        41.00%	  1,454	57.40%	 2,036	  3,547	Ida     	23.82%	    917	74.82%	 2,880	  3,849		   -302	    537
Iowa	        49.10%	  4,202	48.90%	 4,188	  8,556	Iowa    	36.41%	  3,547	61.68%	 6,009    9,742		 -1,186	    655
Jackson	        61.30%	  6,102	36.90%	 3,673	  9,957	Jackson  	36.18%	  4,029	62.33%	 6,940	 11,135		 -1,178	  2,073
Jasper	        52.40%	 10,250	44.90%	 8,794	 19,566	Jasper  	38.33%	  7,737	59.87%	12,084	 20,184		   -618	  2,513
Jefferson	58.40%	  5,070	38.30%	 3,324	  8,675	Jefferson	48.21%	  4,319	49.59%	 4,443	  8,959		   -284	    751
Johnson	        69.70%	 51,027	28.30%	20,732	 73,231	Johnson  	70.57%	 59,177	27.34%	22,925	 83,851		-10,620	 -8,150
Jones	        54.00%	  5,446	43.70%	 4,405	 10,080	Jones   	38.34%	  4,213	59.81%	 6,572	 10,989		   -909   1,233
Keokuk   	46.90%	  2,518	50.50%	 2,712	  5,366	Keokuk  	26.66%	  1,414	71.60%	 3,797	  5,303		     63	  1,104
Kossuth	        50.30%	  4,625	47.00%	 4,329	  9,203	Kossuth 	29.66%	  2,696	69.03%	 6,275	  9,090		    113	  1,929
Lee	        56.60%	  9,821	40.70%	 7,062	 17,352	Lee     	39.09%	  6,541	58.40%	 9,773   16,734		    618   3,280
Linn	        59.80%	 68,037	38.40%	43,626	113,721	Linn    	55.61%	 70,874	41.87%	53,364	127,458		-13,737	 -2,837
Louisa	        50.80%	  2,523	46.60%	 2,314	  4,968	Louisa   	32.37%	  1,726	65.64%	 3,500	  5,332		   -364	    797
Lucas	        45.30%	  2,029	52.10%	 2,330	  4,476	Lucas   	27.73%	  1,284	70.99%	 3,287	  4,630		   -154	    745
Lyon	        26.80%	  1,675	71.50%	 4,471	  6,255	Lyon    	15.55%	  1,067	83.16%	 5,707	  6,863		   -608	    608
Madison	        43.80%	  3,733	53.70%	 4,579	  8,529	Madison 	31.90%	  3,134	66.24%	  6,507	  9,824		-1,295	    599
Mahaska	        40.80%	  4,464	57.30%	 6,271	 10,952	Mahaska 	25.38%	  2,894	72.76%	 8,297	 11,404		   -452	  1,570
Marion	        43.40%	  7,421	54.10%	 9,256	 17,115	Marion  	32.12%	  6,178	65.84%	12,663	 19,232		 -2,117	  1,243
Marshall	53.40%	 10,023	44.10%	 8,278   18,765	Marshall	45.08%	  8,176	52.77%	 9,571	 18,136		    629	  1,847
Mills	        40.60%	  2,976	57.10%	 4,183	  7,327	Mills   	30.33%	  2,508	67.55%	 5,585	  8,268		   -941	    468
Mitchell	55.10%	  3,179	42.80%	 2,469	  5,766	Mitchell	35.26%	  2,053	63.16%	 3,677	  5,822		    -56	  1,126
Monona	        47.80%	  2,295	50.30%	 2,411	  4,797	Monona  	29.76%	  1,407	68.70%	 3,248	  4,728		     69	    888
Monroe	        46.00%	  1,798	51.20%	 2,000	  3,909	Monroe  	26.37%	  1,078	72.77%	 2,975	  4,088		   -179	    720
Montgomery	44.00%	  2,326	54.60%	 2,887	  5,289	Montgomery	29.72%	  1,583	68.69%	 3,659	  5,327		    -38	    743
Muscatine	56.80%	 10,920	41.20%	 7,929	 19,236	Muscatine	45.34%	  9,372	52.36%	10,823	 20,671		 -1,435	  1,548
O'Brien	        31.80%	  2,338	66.50%	 4,894	  7,354	O'Brien 	20.78%	  1,569	77.62%	 5,861	  7,551		   -197	    769
Osceola	        33.00%	  1,037	64.50%	 2,027	  3,145	Osceola 	18.06%	    601	80.83%	 2,690	  3,328		   -183	    436
Page	        39.30%	  2,900	59.00%	 4,351	  7,370	Page    	27.71%	  2,086	70.66%	 5,319	  7,528		   -158	    814
Palo Alto	50.00%	  2,428	47.20%	 2,294	  4,858	Palo Alto	30.64%	  1,519	67.97%	 3,370	  4,958		   -100	    909
Plymouth	37.00%	  4,629	62.00%	 7,765	 12,515	Plymouth	24.63%	  3,494	73.95%	10,492	 14,188		 -1,673	  1,135
Pocahontas	44.50%	  1,800	52.90%	 2,138	  4,045	Pocahontas	24.40%	    933	73.92%	 2,826	  3,823		    222	    867
Polk	        56.10%	120,984	41.60%	89,668	215,751	Polk    	56.52%	146,250	41.27%	106,800	258,755		-43,004	-25,266
Pottawattamie	48.00%	 20,436	49.90%	21,237	 42,580	Pottawattamie	40.61%	 18,575	57.38%	 26,247	 45,744		 -3,164	  1,861
Poweshiek	55.00%	  5,519	43.30%	 4,340	 10,033	Poweshiek	42.47%	  4,306	55.79%	 5,657	 10,140		   -107	  1,213
Ringgold	46.00%	  1,236	52.10%	 1,401	  2,689	Ringgold	26.12%	    709	72.51%	 1,968	  2,714		    -25	    527
Sac	        44.60%	  2,256	53.50%	 2,705	  5,056	Sac     	25.09%	  1,389	73.37%	 4,061	  5,535		   -479	    867
Scott	        56.60%	 48,927	42.10%	36,365	 86,378	Scott   	50.68%	 46,926	47.17%	43,683	 92,599		 -6,221	  2,001
Shelby	        44.30%	  2,863	54.00%	 3,488	  6,463	Shelby  	28.83%	  1,959	69.12%	 4,697	  6,795		   -332	    904
Sioux	        18.20%	  3,030	80.90%	13,490	 16,679	Sioux   	15.85%	  3,019	82.31%	15,680	 19,051		 -2,372	     11
Story	        56.80%	 26,548	40.70%	18,995	 46,722	Story   	57.16%	 29,175	39.85%	20,340	 51,038		 -4,316	 -2,627
Tama	        55.00%	  4,899	42.90%	 3,820	  8,904	Tama    	39.53%	  3,577	58.61%	 5,303	  9,048		   -144	  1,322
Taylor	        44.50%	  1,347	53.10%	 1,607	  3,029	Taylor   	22.96%	    746	75.81%	 2,463	  3,249		   -220	    601
Union	        50.30%	  3,000	46.60%	 2,781	  5,964	Union   	33.32%	  2,061	64.83%	 4,010	  6,185		   -221	    939
Van Buren	42.50%	  1,546	54.60%	 1,986	  3,640	Van Buren	23.08%	    875	75.42%	 2,859	  3,791		   -151	    671
Wapello	        54.90%	  8,820	41.40%	 6,663	 16,075	Wapello 	37.24%	  5,821	60.87%	 9,516	 15,633		    442   2,999
Warren	        49.40%	 12,299	48.70%	12,144	 24,912	Warren  	40.51%	 12,574	57.29%	17,782	 31,039		 -6,127	   -275
Washington	48.60%	  5,170	49.30%	 5,247	 10,642	Washington	38.77%	  4,561	59.25%	 6,971	 11,765		 -1,123	    609
Wayne	        45.50%	  1,357	52.50%	 1,565	  2,981	Wayne   	23.38%	    727	75.20%	 2,338	  3,109		   -128	    630
Webster	        53.00%	  9,917	44.60%	 8,337	 18,708	Webster 	37.11%	  6,613	61.37%	10,938	 17,822		    886	  3,304
Winnebago	53.20%	  3,254	44.60%	 2,730	  6,122	Winnebago	35.76%	  2,135	62.09%	 3,707	  5,970		    152	  1,119
Winneshiek	60.10%	  6,829	37.60%	 4,273	 11,367	Winneshiek	46.56%	  5,617	51.68%	 6,235	 12,064		   -697	  1,212
Woodbury	49.10%	 21,983	49.60%	22,219	 44,815	Woodbury	41.23%	 18,704	57.63%	25,736	 45,362		   -547	  3,279
Worth	        59.90%	  2,567	37.60%	 1,612	  4,282	Worth   	36.12%	  1,596	61.97%	 2,738	  4,418		   -136	    971
Wright	        48.50%	  3,102	50.00%	 3,198	  6,395	Wright  	31.92%	  1,996	66.13%	 4,136	  6,254		    141	  1,106
That was a lost cause, and the DNC knew it.
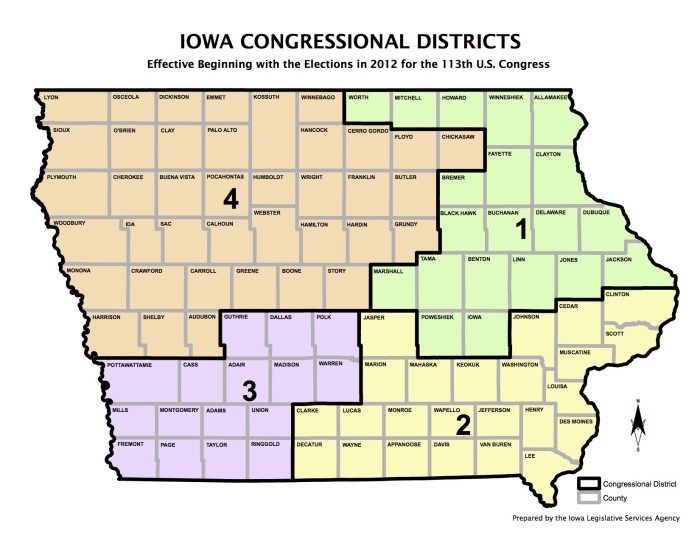
No, the various Iowa motherships were in business to steal US congressional district seats [there are four congressional districts in Iowa].
They didn't do too badly - out of three contested seats, they stole one [CD 3], and almost stole a second one [CD 2].
You might remember Pelosi causing a kerfluffle over Mariannette Miller-Meeks' 6-vote win in the 2nd Iowa CD.
They were trying to lock in their steal.
													        2008 total	Obama 2008
					         2008						 2020		minus	        minus
		Obama 2008	McCain	         total		Biden 2020	Trump	         total		2020 total	Biden 2020
The Des Moines mothership - Iowa congressional district 3
Dallas 46.20% 15,149 51.80% 16,954 32,759 Dallas 47.98% 26,879 49.96% 27,987 56,022 -23,263 -11,730 Guthrie 44.80% 2,625 52.50% 3,074 5,858 Guthrie 31.16% 1,985 67.05% 4,272 6,371 -513 640 Jasper 52.40% 10,250 44.90% 8,794 19,566 Jasper 38.33% 7,737 59.87% 12,084 20,184 -618 2,513 Madison 43.80% 3,733 53.70% 4,579 8,529 Madison 31.90% 3,134 66.24% 6,507 9,824 -1,295 599 Polk 56.10% 120,984 41.60% 89,668 215,751 Polk 56.52% 146,250 41.27% 106,800 258,755 -43,004 -25,266 Warren 49.40% 12,299 48.70% 12,144 24,912 Warren 40.51% 12,574 57.29% 17,782 31,039 -6,127 -275
													        2008 total	Obama 2008
					         2008						 2020		minus	        minus
		Obama 2008	McCain	         total		Biden 2020	Trump	         total		2020 total	Biden 2020
The Des Moines mothership
Dallas	        46.20%	 15,149	51.80%	16,954	 32,759	Dallas	47.98%	 26,879	49.96%	27,987	 56,022		-23,263	        -11,730
Guthrie	        44.80%	  2,625	52.50%	 3,074	  5,858	Guthrie	31.16%	  1,985	67.05%	4,272	  6,371		   -513	            640
Jasper	        52.40%	 10,250	44.90%	 8,794	 19,566	Jasper	38.33%	  7,737	59.87%	12,084	 20,184		   -618	          2,513
Madison	        43.80%	  3,733	53.70%	 4,579	  8,529	Madison	31.90%	  3,134	66.24%	6,507	  9,824		 -1,295	            599
Polk	        56.10%	120,984	41.60%	89,668	215,751	Polk	56.52%	146,250	41.27%	106,800	258,755		-43,004	        -25,266
Warren	        49.40%	 12,299	48.70%	12,144	 24,912	Warren	40.51%	 12,574	57.29%	17,782	 31,039		 -6,127	           -275
ping to you
2020
District 1
Republican	Hinson	212,088	51.20
Democratic	Finken-	201,347	48.70
		10,741

District 2
Republican	Meeks	196,964	49.91
Democratic	Hart	196,958	49.91
		6

District 3
Democratic	Axne 	219,205	48.90
Republican	Young	212,997	47.60
Libertarian	Holder	 15,361	 3.40
		6,208

District 4
Republican	Feenstra	237,369	62.00
Democratic	Scholten	144,761	37.80
		92,608
Wow...... O.o
Johnson	        69.70%	 51,027	28.30%	20,732	 73,231	Johnson  	70.57%	 59,177	27.34%	22,925	 83,851		-10,620	 -8,150
Linn	        59.80%	 68,037	38.40%	43,626	113,721	Linn    	55.61%	 70,874	41.87%	53,364	127,458		-13,737	 -2,837
What identifies them is the WILD number of votes that The Joek beat Obama by (far right table entry).
All controlled by Democrat motherships [there are also Republican motherships, but those are a little different animal].
This is very interesting, thanks.
The one I did for Michigan pretty clearly shows that the Michigan Republicans colluded with the Democrats to throw the state to joek.
I am at the point where there is so much information, I need to rely on intuition, but this rings some personal bells which I need to investigate.
Again, thanks, the historical importance of this type of research will come eventually.
Really interesting stuff.
Great job. ........I like the premise.
Meanwhile, Muskegon, which is (as you aware) a big Democrat stronghold in that area, said "meh" to the joek:
Grand Rapids Republican mothership
	  Odiousbama 2008   mclame	      total		  biteme 2020	   Trump		       bammy 2008 minus
													       joek 2020
Allegan   43.71%   24,165   54.38%   30,061   55,279	Allegan	  36.39%   24,449  61.60%   41,392    67,195	  -284
Kent	  49.44%  149,909   48.92%  148,336  303,235	Kent	  51.91%  187,915  45.78%  165,741   362,031	-38006
Ottawa	  37.30%   50,828   61.15%   83,330  136,268	Ottawa	  38.35%   64,705  59.81%  100,913   168,713	-13877

Muskegon  63.87%   53,821   34.58%   29,145   84,271	Muskegon  49.37%   45,643  48.82%   45,133    92,444	  8178
Trump came 500 votes away from beating the joek in MUSKEGON, for crying out loud!!!
I'm sure the margins in DeToilette were similar - until they got "adjudicated"...
This is a mild one - they were only stealing seats in CONgress. The swing states are more interesting.
I rolled this one out first because it was less challenging graphically.
See post #15, where you can see the Republicans sandbagging Trump in 2020.
Trump needs to hire you.
I am aware of the name but have not looked into it yet. I will educate myself shortly.
Catherine Engelbrecht dropped this flaming bag of election dog poo on Chris Wray's doorstep three weeks ago.
The grenade's pin has been pulled, and Wray and Garland are soiling themselves:
Here it is, copied directly from Engelbrecht's site....
=============================================
Earlier this week [August 2021], a document I’d written regarding one of our research projects made its way into an article published by Breitbart. It is about ballot trafficking. The report is accurate.
Ballot trafficking is one of three investigations undertaken by True the Vote in particular areas of interest. We have not spoken publicly of these investigations for various reasons, but primarily because the work is ongoing and time is short.
What follows is a brief statement about the ballot trafficking project, why we did what we did, what we are finding, and what comes next.
This is just the beginning.
___________________________________________
What We Did
In late 2020, True the Vote engaged a select team of contractors and set out to determine whether widespread ballot trafficking was occurring as part of an organized criminal enterprise.
We’d watched the mass mail out of paper ballots to highly inaccurate voter records, the harried installation of ballot dropboxes privately funded by billionaire tech magnates, and the hundreds of legislative changes, lawsuits, and consent decrees that fundamentally altered election processes. All of it came together in 2020, under the fog of COVID. It was planned. It was purposeful.
Having studied election process for decades, our team was well aware of the pitfalls associated with America’s uniquely insecure approach to elections. We knew that attempts to prove certain types of election malfeasance would fail, so we chose instead to focus on the grifts that would necessarily leave trackable, provable data trails.
To test our trafficking theory, we acquired over ten trillion location-based cell signals in major metropolitan areas across six states. Initially, we worked with whistleblowers and witnesses, but soon enough, the data alone told the tale. Using mobile and GPS data, we mapped the travel patterns of ballot traffickers to ballot dropboxes.
This tracking method is explained in great detail by The New York Times in a series they ran called The Privacy Project. They and others have published much about how mobile data was used to track President Trump and identify individuals at the January 6th event at the Capitol. Law enforcement uses this type of data routinely. So, lest anyone say we did anything untoward, let us be very clear, all of this data is regularly bought and sold, about all of us.
What We Found
Our findings reveal overwhelming evidence of ballot trafficking, some of which is highlighted in the article. We have much more.
All our research, including suspected locations where ballots were delivered, processed, and distributed, along with the individual devices associated, has been submitted in the form of a formal complaint, along with all data, to the FBI. Briefings have been provided to state law enforcement and political leadership in several states. These conversations will continue to broaden in the coming days.
We’ve also acquired over a petabyte of video surveillance data. The quality of this video is inferior overall; lighting is bad, cameras are poorly positioned, timestamps are manipulated, key timeframes are often missing. Nevertheless, we are working video by video, using proprietary AI-based code we’ve written to screen the over 100,000 clips in our possession. The result? We are successfully finding video evidence that corroborates the digital data and supports the need for full investigations by law enforcement.
Our novel approach offers never before seen insights into the exploitation of America’s elections.
Figure 1: 24-hour Route in Georgia
This person’s route included stops at 5 organizations and 27 individual ballot drop boxes, traveling across 6 counties. Red dots represent ballot drop boxes, blue house icons (circled) represent targeted organizations, blue line represents daily travel path
What Comes Next?
To date, law enforcement has not taken action.
Make no mistake, what we have found will be made known. If law enforcement doesn’t initiate investigations, we have plans to release all data, all video, publicly.
So, that’s where we are. This is a massive undertaking. And it continues. Once all six states are completed to the best of our ability, and if at that point law enforcement still has not acted, we will publicly release it all.
How long will that take? Hard to say. We could release what we have now. And we may. But if it serves the greater good to hold on a while longer, then that’s the option we will take.
One way or another ballot trafficking will soon be exposed on a massive scale.
The question is - what will Americans do about it? Many improvements must be made, but in the end, they all start with you - and with me - with each of us as citizens. Each of us must invest time and attention in elections. Where to begin? Well … we know that bloated, inaccurate voter rolls are the fuel used to fire criminal manipulations of process. So, you can start by helping your county clean up its voter rolls.
We’ve built an app to automate citizen-led voter roll clean-up efforts called IV3. The plan was to launch this week, but we’ve pushed it out a few more days to first share all of the above information with you. Next week, we’ll launch the app. It will be the first in a series of tools and supports to help citizens’ restore election integrity.
Friends, this is it. It’s time to roll up our sleeves and work. Set your mind now to serve in elections in your county. Once that’s in order, reach out to others. True the Vote will be here to offer help every step of the way.
We’re all in this together - and working together we really can true the vote. All is not lost. Stay engaged.
For Freedom.
Ever onward - Catherine Engelbrecht
Disclaimer: Opinions posted on Free Republic are those of the individual posters and do not necessarily represent the opinion of Free Republic or its management. All materials posted herein are protected by copyright law and the exemption for fair use of copyrighted works.