
Figure 1: The datasets used to estimate the TSI spectrum, from 1600.
Posted on 06/18/2014 9:07:49 PM PDT by Ernest_at_the_Beach
This is the first of many posts. It is primarily about the entirely new discovery of a notch filter, which electrical engineers will immediately recognize, but few others will know. Notch filters are used in electronics to filter out a hum or noise. You will have some at home, but everyone seems to have missed the largest notch filter running on the planet.
This post is also about the broad outline of the new solar model. It’s a O-D (zero-dimensional) model. Its strength lies in its simplicity — it’s a top down approach. That solves a lot of problems the larger ambitious GCMs create — they are a bottom up approach, and effectively drown in the noise and uncertainty. This model does not even attempt to predict regional or seasonal effects at this stage. First things first — we need to figure out the main drivers of the global climate.
Here David explains why sinusoids are such powerful tools. Some of the most important graphs here are in frequencies — that’s where we non-EE’s (Electrical Engineers) will have to concentrate. Pay attention to the logarithmic scale on the bottom. 1,000 year cycles are on the left, and 1 year cycles are on the right.
There is a lot to cover. As you read, good skeptics will be thinking of criticisms and questioning assumptions. That’s all excellent, please bear in mind we have asked many of these at length already (like, is it fair to assume linearity?) and this is a short introductory article. There is a lot to discuss. We assume, but only temporarily, that the Sun’s radiation might be associated with all the warming (note I didn’t say “cause”). This assumption is used for the investigation and then dropped and tested. It parallels what CO2 driven models do — they assumed CO2 caused all the warming. They just got stuck on the “testing” step. Also, David used Fourier analysis to investigate the datasets and find the filters, then used those filters he discovered to build a model. This two stage approach means skeptics may spot red flags that are relevant to one stage, but made irrelevant by the second stage. I’m flagging this at the start in the hope that we generate more constructive criticism.
No time? — skip to Figure 5 and 6 for the most important action! Look at the spike down at 11 years. See how it happens in all the datasets. (Figure 6 was the moment when Bob Carter sat up dead straight in his chair).
– Jo
——————————————————————————————————–
Guest post by Dr David Evans, 15 June 2014
The carbon dioxide theory is clearly inadequate, as readers here know only all too well. So we wondered if the changes in the Sun might be causing some of the recent global warming. That is, the global warming over the last few decades, maybe back to 1800 or so.
Solar radiation and temperature
The best and most obvious solar datasets are those for total solar irradiance (TSI), or the total energy from the sun at all electromagnetic frequencies — mainly visible light, but also UV and some infrared. These datasets estimate the total energy from the Sun falling upon the plane that is at the average distance of the Earth from the Sun (1 AU, or astronomical unit). This TSI data is thus deseasonalized, so it cannot tell us anything about what is happening on time scales of less than a year or at frequencies greater than one cycle per year (this will become important later). TSI is measured in Watts per square meter (W/m2).
The temperature we are most interested in is the one for our immediate environment, the “global average surface air temperature”, namely air temperatures at or near the surface averaged across the entire planet. When we use “temperature” without qualification in these posts, we mean this temperature. “Global warming” is the rise in this temperature.
The initial aim of this project is to answer this question: If the recent global warming was associated almost entirely with solar radiation, and had no dependence on CO2, what solar model would account for it?
We are envisaging some sort of black box, whose input is TSI and whose output is temperature.
The climate system is approximately linear for small perturbations such as have occurred since the end of the last ice age. It is common in climate modeling to assume that the climate system is linear. The climate system is also “invariant”, which just means that its properties do not change significantly with time. So we assume that the climate system is linear and invariant, at least for the last few hundred years (and presumably as far back as the end of the last ice age).
The way to analyze a linear and invariant system is with sinusoids (aka sine waves). A sinusoid has a frequency, an amplitude, and a phase. Sinusoids are special for linear invariant systems, because:
Lots of systems are linear and invariant, such as free space for electromagnetic fluctuations, which is why sinusoids and Fourier analysis are so ubiquitous in our analysis of the universe. While Fourier analysis can also be used for mere curve fitting, its true significance and power is that sinusoids are eigenfunctions of all linear invariant systems.
So let’s analyze the TSI and temperature datasets in the frequency domain. That is, we will recast them as sums of sinusoids.*
TSI has only been measured by satellites from late 1978. However the approximate numbers of sunspots have been recorded since 1610, and TSI has been reconstructed from the number of sunspots (Lean 2000). The main TSI datasets are the PMOD satellite observations from late 1978, Lean’s reconstruction from sunspots from 1610 to 2008, and the Steinhilber reconstructions from beryllium isotopes in ice cores going back 9,300 years.
The main TSI datasets are noisy and sometimes contradict one another. We did not attempt to pick a “best” empirical record, but instead tried to find the spectrum of TSI that best fits nearly all of the main TSI datasets. We only care about the amplitudes here, because the phases of the sinusoids cannot be reliably determined from the climate datasets.
Figure 1: The datasets used to estimate the TSI spectrum, from 1600.
The many disagreements of the TSI datasets make for a noisy combined amplitude spectrum.
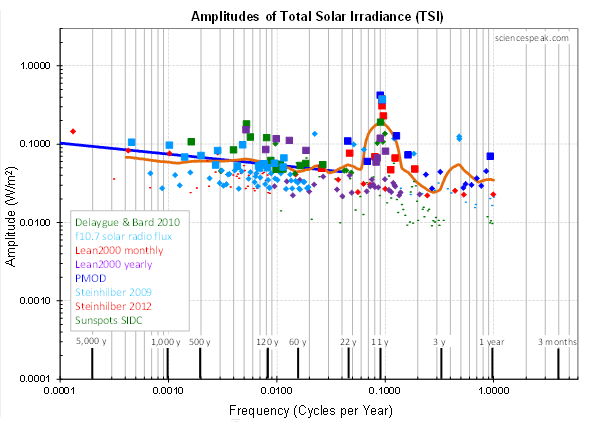
Figure 2: The amplitude spectra of the various TSI datasets (the series of colored dots), and the smoothed curve of best fit (orange line). Larger dots have more weight in the smoothing. Note the peak around 11 years.
The TSI amplitude spectrum is the smooth curve in orange in Figure 2. It is basically straight over more than three orders of frequency magnitude, except for a pronounced spike around 11 years, the sharpness of which is understated by the smoothed curve.
The length of the sunspot cycle averages 11 years, though individual “cycles” vary between 8 and 14 years. So we’d expect to see stronger sinusoids around 11 years. This spectrum is about what we’d expect.
The main temperature datasets are the satellite records since late 1978 (UAH and RSS), the surface thermometer records since 1850 or 1880 (HadCrut4, GISTEMP, and NCDC), the two comprehensive proxy time series of Christiansen and Ljungqvist in 2012 going back to 1500 with 91 proxies and to 0 AD with 32 proxies, and the Dome C ice cores going back 9,300 years (to match the TSI data).
The main temperature datasets are noisy and sometimes contradict one another. Again we did not pick a “best” empirical record, but simply tried to find the spectrum that best fits all the main datasets.
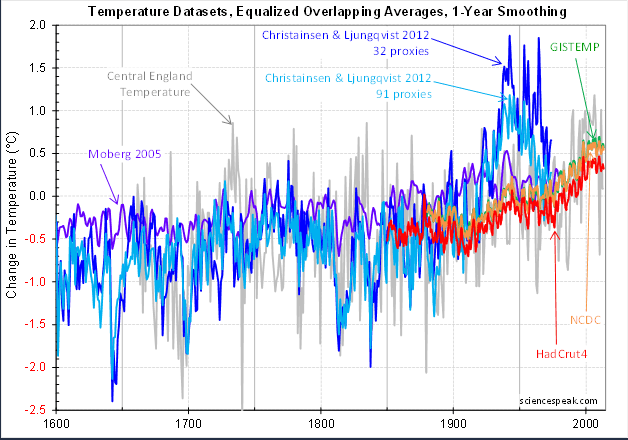
Figure 3: The datasets used to estimate the temperature spectrum are more contradictory further back in time.
The temperature amplitude spectrum, the smooth orange curve in Figure 4, is essentially straight over more than three orders of frequency magnitude, with no other definite features.
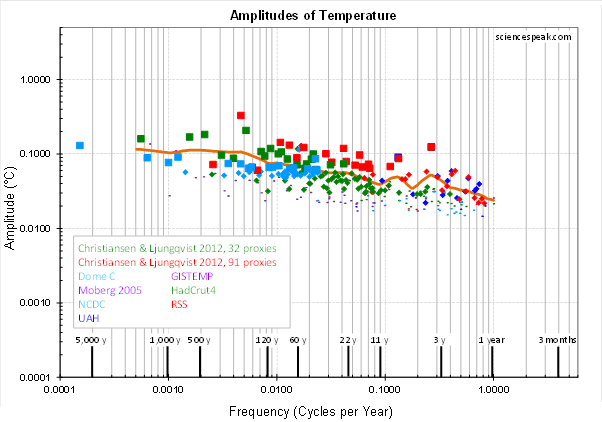
Figure 4: The amplitude spectra of the various temperature datasets (the series of colored dots), and the smoothed curve of best fit (orange line). Larger dots have more weight in the smoothing.
This is unexpected, because TSI is the energy input that warms the Earth. The TSI peaks every 11 years or so, yet there is no detected corresponding peak in the temperature, even using our new low noise optimal Fourier transform!
(To put some numbers on it: TSI typically varies from the trough to the peak of a sunspot cycle by about 0.8 W/m2 out of 1361 W/m2. At the surface of the Earth, this is about 0.14 W/m2 of unreflected TSI. If this was a long term change, the Stefan-Boltzmann equation would imply a change in radiating temperature of about 0.05°C, which would result in a change in surface temperature of about 0.1°C. The peaks only last for a year or two, so the low pass filter in the climate system would reduce the temperature peak to somewhat below 0.1°C. The error margin of the temperature records is generally about 0.1°C, but Fourier analysis will usually find repetitive bumps down to a small fraction of the error margin, maybe a tenth. However these bumps are not quite regularly spaced, so the threshold of detectability would be a bit higher. In any case, we’d expect the temperature peaks to be detectable using the data and methods we have employed, though not by a huge margin. Later in post IV of this series we propose a physical interpretation of the notch that implies a countering of the TSI warming, but of course such a countering would be very unlikely to completely cancel out the temperature effects of the TSI peak. But given that the margin for detection for the TSI peak alone is not great, it is credible that the mainly-countered TSI peaks are indeed not detectable.) This paragraph was corrected. **
This is an important clue. It’s the absence of something expected. (Like the “curious incident of the dog in the night-time”, in Silver Blaze, a Sherlock Holmes story. The clue was that the dog did nothing. The dog did not bark when the crime was being committed in the house, indicating that the dog was familiar with the criminal, which was a vital clue to their identity.)
In electronics, a filter in audio equipment that removes the hum due to mains power is called a notch filter. It removes a narrow range of frequencies, which looks like a notch on a frequency graph. Without a notch filter, the mains hum at 50 or 60 Hz would often be audible. It appears that something is removing the 11 year “solar hum” from the temperature, so we call this phenomenon “the notch”.
A transfer function tells how a sinusoid in the input is transferred through the system to the output. We are only concerned with amplitudes (that is, not phases), so its value at a given frequency is simply the output amplitude at that frequency divided by the input amplitude at that frequency. Dividing the orange line in Figure 4 by the orange line in Figure 2, we arrive at the empirical transfer function shown in Figure 5.

Figure 5: The amplitude of the empirical transfer function. The gray zone is a graphical device to make it easier to judge and compare locations on and between the graphs—because it is in exactly the same location in all the diagrams in this project.
The transfer function is fairly flat, except for the notch around 11 years, and hints of a fall off at the higher frequencies.
The notch is robust. We computed the empirical transfer function from subsets of the data, such as data before 1945 or data after 1945, and in each case the notch is clearly visible.
Figure 6: The amplitudes of the empirical transfer function when the data is restricted in the ways marked (that is, using a subset of the data used to find Figure 5). The black line and the gray zone are as in Figure 5.
The notch is such a prominent feature that we can verify it just by comparing the TSI to the temperature:

Figure 7: Solar radiation shows a strong heartbeat about every 11 years, but the temperature does not.
In the next post, we’ll build the solar model, starting with a notch filter.
*A technical side note: The traditional tool for estimating the spectrum of a time series (such as a climate dataset) is the discrete Fourier transform (DFT). The Fast Fourier Transform (FFT) is just a faster way of computing the DFT. Although the signals we are after are detectable using the DFT, and were initially detected using the DFT, they are not sufficiently clear and we wanted to gain more certainty in the analysis. So we developed the optimal Fourier transform (OFT) for this paper. The OFT is a new development in Fourier analysis, with greater sensitivity and frequency resolution than the DFT. It is described in the paper “The Optimal Fourier Transform (OFT)”. That paper contains examples in which the OFT does things that the DFT cannot. The OFT is used in all the analysis in this project.
The OFT is better than the DFT at estimating the exact frequencies of sinusoids in a time series, and it introduces less noise into the analysis. Like the DFT, the OFT is applied to a time series and produces an estimate of its spectrum, describing the sinusoids in the spectrum as a series of coefficients of cosines and sines. Unlike the DFT, it can analyze irregular time series (data points not equally spaced through time), it considers all frequencies when estimating the spectrum (rather than just a small pre-determined set of equally-spaced frequencies, like the DFT), it orders the spectral sinusoids by amplitude (so the lesser ones, which are probably just describing noise, can be easily discarded), it typically describes the spectrum in far fewer sinusoids than a DFT (because it stops once the sum of the spectral sinusoids is close enough to the original time series), but it is not invertible (the original time series cannot be exactly recovered from the OFT). The OFT takes much longer to compute than the DFT, because it uses multivariate function minimization to fit sums of sinusoids at variable frequencies to the time series.
** Original paragraph, before correction: (To put some numbers on it: TSI typically varies from the trough to the peak of a sunspot cycle by about 0.8 W/m2. If this was a long term change, the Stefan-Boltzmann equation would imply a change in radiating temperature of about 0.26°C, which would result in a change in surface temperature of about 0.5°C. Even allowing for some attenuation by a low pass filter, there ought to be a detectable temperature peaks.)
Comment: While the correction makes the margin for detection of any corresponding TSI peaks smaller, it increases the likelihood that what remains of the peaks, after being mainly canceled by a countervailing cooling force, are undetectable.
fyi
I read the first one. I have had one too many adult beverages in the meantime to properly absorb the data.
I will have to read later, however, this is very interesting.
Elliot Wave Theory meets The Hockey Stick.
They’ve figured out that the Sun drives the Earth’s climate.
Let’s see if they can find the orbital forcing, too!
Clouds.
Wow! Cool use of FFT.
OMG. Read it anyway.
Now I am going to have to throw away my “Henny Penny” book and stop believing that the sky is falling.
Wait til my progressive friends hear about this!
Thanks to a liberal education, they can only hear about it, they can’t read.
Would it be possible to translate this into English from the original Engineerese?
But, in that last figure, there is a noticeable increase in *overall* solar radiation, which seems to correspond pretty well to the overall increase in temp shown on the graph. So maybe the climate has too much inertia to swing wildly in concert with the sun’s short-term fluctuations, but can be pushed along just fine by the overall radiance of the sun.
Which would still allow for the overall radiance to be the driver of climate, and would explain why the recent weaker solar cycles (and the pending much weaker one) seem to correspond pretty well to the absolute lack of “warming” over the past 17+ years.
______
I was sort of musing on this last night. So much of “climate science” these days focuses on just the last 2000-3000 years or so, but climate goes arm-in-arm with the geology of the planet. It’s a long-term phenomenon. We humans have only had civilization for those ~3000 years or so, and before that were barely able to scrape by. What we lose sight of, all too often, is that this is (likely) just a temporary warmer blip in the middle of a crushing ice age. And based on data sets like the Vostok ice cores, our little blip is nearing its end (if the length of the previous “blips” are anything to go by). In the next 1000-5000 years or so, we may see a return to the devastatingly frigid temps that marked the 60,000 years prior to that (a couple of wishful-thinking articles argue that this one might be “longer” at 20,000+ years, and one even suggests 50,000). If the Vostok data is anything to go by, our current interglacial is actually one of the colder ones. And we’ve probably got a long way to go before the earth passes out of this current ice age.
We should be so lucky to have that inevitability put off by “climate change”, because the alternative is a frozen hell where food becomes horrifically scarce.
(PhysOrg.com) -- Sunspot formation is triggered by a magnetic field, which scientists say is steadily declining. They predict that by 2016 there may be no remaining sunspots, and the sun may stay spotless for several decades.
The last time the sunspots disappeared altogether was in the 17th and 18th century, and coincided with a lengthy cool period on the planet known as the Little Ice Age....and lasted 400 years.
Good luck surviving with a lot less electricity and GE modified seeds.
Read more at: http://phys.org/news203746768.html#jCp
I’m sure if they used enough Fourier transforms on their data they’ll be able to find the AGW hiding in there somewhere.
Get some rest...and thanks for cmmening.
I went to link provided to look for it, but it must not be released yet. I really look forward to seeing it.
In the comment I see this conversation:
=============
John, who eats meat & never visits Paddington
June 16, 2014 at 6:41 am
"Thanks David,
I look forward to the additional posts, but I’m already curious what would cause an 11 year notch?. For a notch filter, you need a cancellation signal of the same amplitude and frequncy, but opposing phase. I’m guessing you already have ideas ? Another solar forcing, oceans currents, etc ?"
David Evans
June 16, 2014 at 2:19 pm
"Stumped us for months. Eventually figured it out, we think. Joanne eventually noticed the vital clue. Will be revealed soon…"
Not sure what this means, but are we doomed?
Is there something I should be doing to prepare?
or should I just go back and suck on my Cherry/Pineapple Popsicle and count my pennies?
Don’t look for me to do it!
Or make a really bitchin’ EQ/filter plugin for Pro Tools ;)
/Music thing
Oh, we’re talking science. I saw Notched Filter and thought about the good old days when I smoked More Menthols.
What does this mean?
In terms that people no more intelligent than Rachel Jeantel can understand.
TSI is not really a good metric to analyze the solar input variability. That is because of the nature of sunspots created by magnetic surface activity. Basically - The brighter active regions of sunspots are negated by the darker regions of sunspots. It is just the nature of the physics of the magnetically active regions. So visible light does not show a lot of variability. That however does not mean there is little variation in activity during the cycle. UV light would be the best metric. It can have a 25 to 40 % variability between an active sun and a quiet sun. And it does not experience that negating duality of visible light around active sunspot regions. You should also use overall magnetic field strength and the speed of the solar wind.
Disclaimer: Opinions posted on Free Republic are those of the individual posters and do not necessarily represent the opinion of Free Republic or its management. All materials posted herein are protected by copyright law and the exemption for fair use of copyrighted works.