
Posted on 12/08/2012 6:39:16 AM PST by blam
3 Bearish Signs In A Sea Of Negativity
12/07/2012 12:48 AM
Cullen Roche
Last week I published the 3 bullish signs in a sea of negativity (click here). So I figured I’d even the score and mark down some of the more bearish economic signs I’ve been seeing lately.
Yes, there’s a lot to be negative about, but one could easily argue that the negativity is justified. The following indicators are all important barometers of economic growth. This will be sure to brighten your day before you head into the weekend!
Rail Traffic is grinding to a halt. As I noted earlier, rail traffic is slowing substantially. This week’s data showed negative growth in intermodal traffic and the 12 week moving average has slowed to just 1.65%. This has tended to be a leading indicator of recession so the downtrend in this data is certainly a red flag.
(Chart via Orcam Investment Research)
Manufacturers’ New Orders have turned sharply negative. This has been discussed quite a bit in the analyst community and while it’s not necessarily an immediate sign of recession, like rail traffic, it is one of the glaring warning signs of just how weak this economy is.
(Chart via Dshort)
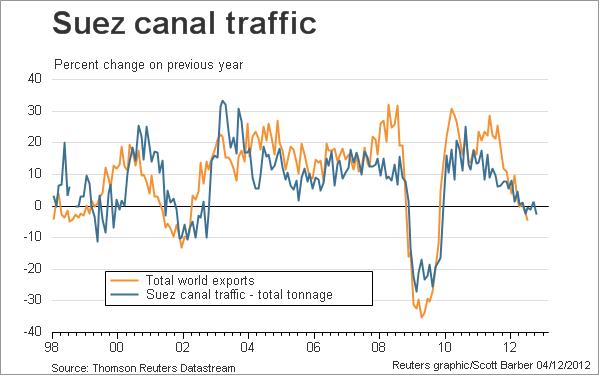
Suez Canal Traffic is turning negative. The Suez is one of the most trafficked waterways in the world and an indicator of global economic growth. The chart below (via Reuters) shows that total tonnage and global export traffic have turned negative.


Confused and interesting.
Baltic Dry looking very ugly. Thanks for posting those informative graphs.


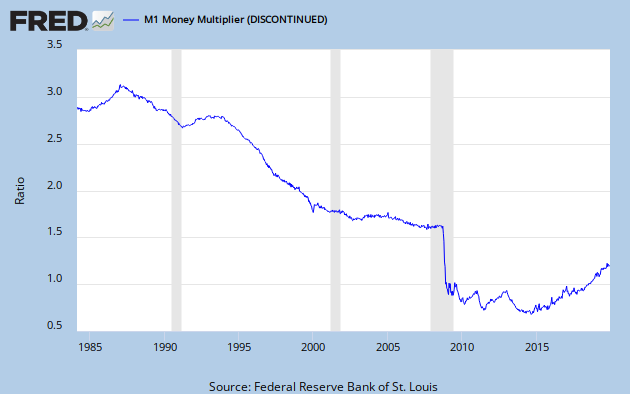
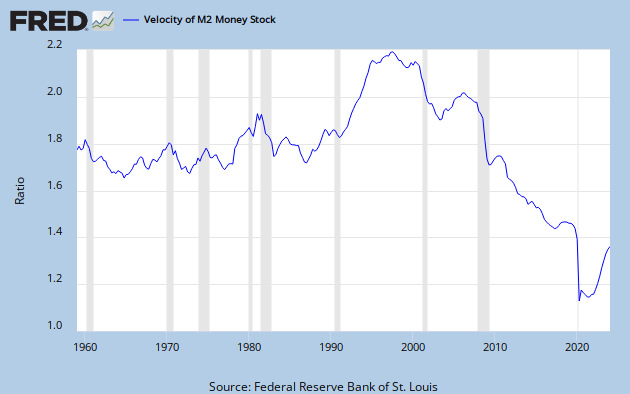
Don’t know what happened to my GDP vs M2 graph
Y axis distorted and last value ~ 1.3 (not <1)
But trend line is true
I know I am not well versed in the arcane argot of specialists but it shouldn't contradict actual English. Just how can there be negative tonnage? If previously delivered cargo were being repossessed and shipped back to the exporting countries it would still be positive tonnage through the Suez Canal.
Do ships actually rise in the water when this negative tonnage is stowed aboard? Too much such tonnage would lift the rudder out of the water and the ship would lose steerage way.
Graph shows year over year % changes in tonnage, not total
I take it to mean that the trend shows a decreasing amount of traffic, not a negative amount.
BTW, when the GDP multiplier goes <1,
it's game over for Capitalism

I think that giant minus sign spells trouble! ;-)

The MSI measure the flow of monetary services received each period by households and firms from their holdings of monetary assets (levels of the indexes are sometimes referred to as Divisia monetary aggregates).
The wording says something different. If it said “negative increase in tonnage.” it would have been clear though awkward. “Decrease in tonnage” would have been clear and correct.
The zero line represents zero growth in tonnage not zero tonnage. Above the zero line means more ship traffic, and below it, less ship traffic. The graph is using the amount of ship traffic as an indicator of positive or negative economic growth.
Disclaimer: Opinions posted on Free Republic are those of the individual posters and do not necessarily represent the opinion of Free Republic or its management. All materials posted herein are protected by copyright law and the exemption for fair use of copyrighted works.