Posted on 08/14/2016 2:07:27 PM PDT by BigEdLB
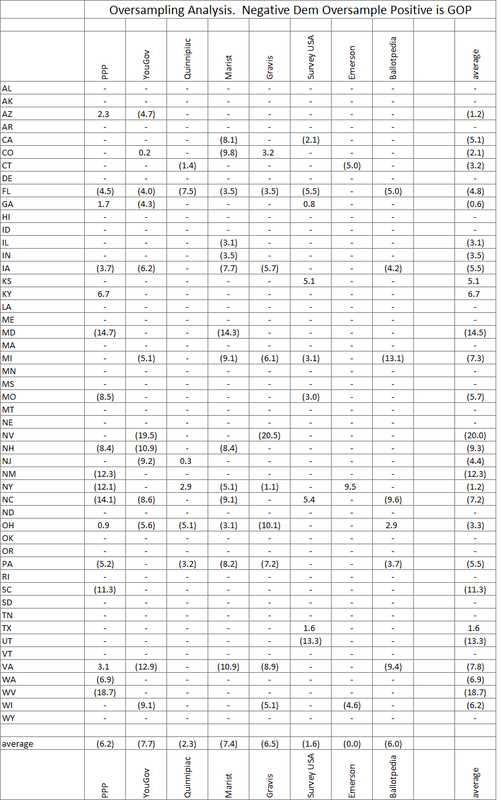
Here is my analysis of oversampling during polling vs Gallups analysis of that actual party ID in a state is.
www.unskewedpolls.com now appears to be a German cosmetics site. Perhaps the URL is available?
I agree, and one thing people might forget is that IF a large swath of Union voters are going to vote Trump, they may be the most unlikely of all to answer a poll, and we all know the reasons why they might think that way.
The final Pew Poll before the 2012 election predicted an Obama 50% & Romney 47% outcome.
The actual election result was Obama: 51.1% & Romney 47.2%.
They were one of the most accurate polling organizations.
http://www.realclearpolitics.com/epolls/2012/president/us/general_election_romney_vs_obama-1171.html
And did the internals of each poll change as it got closer to the election, either D vs R vs I percentages, or adults / registered voters / likely voters?
2012 Election Pew Research Polls
9/22-10/4/2011 1901 Registered Voters +/-3 MOE 48 Obama/48 Romney
11/9-11/14/11 1576 Registered Voters +/-3 MOE 49 Obama 47 Romney
1/11-1/16/2012 1207 Registered Voters +/-3 50 Obama/45 Romney
2/8-2/12/2012 1172 RV +/-3 52 Obama / 44 Romney
3/7-3/11/12 1188 RV +/- 3 54 Obama / 42 Romney
4/4-4/15/12 2373 RV +/- 2.3 49 Obama / 45 Romney
5/9-6/3/12 2388 RV +/- 2.3 49 Obama / 42 Romney
6/7-6/17/12 1563 RV +/- 2.9 50 Obama / 46 Romney
6/28-7/9 2373 RV +/- 2.3 50 Obama / 43 Romney
7/16-7/26 1956 RV +/- 3.2 51 Obama / 41 Romney
9/12-9/16 2268 Likely Voters +/-2.4 51 Obama / 41 Romney
10/4-10/7 1112 Likely Voters +/- 3.4 49 Romney / 45 Obama
10/24-10/28 1495 Likely Voters +/- 2.9 47 Romney / 47 Obama
10/31-11/3 2709 Likely Voters +/- 2.2 50 Obama / 47 Romney
So, like most polls, their summer numbers were -6% from the Republican’s final number.
Perhaps it results from the effect of employed people taking vacations. It sure is curious.
Anyway I take it as an historical fact when looking at the current polling and adjust it accordingly for predictive purposes.
It might be instructive to compare the Pew Poll with a poll that conservatives find to be more balanced in terms of sampling equal numbers of Republicans and Democrats and only uses Likely Voter samples: Rasmussen Reports:
5/14-5/16 1500 Likely Voters +/-3.0 MOE 46 Romney / 45 Obama
6/4-6/6 1500 Likely Voters +/- 3.0 MOE 46 Romney / 46 Obama
6/18-6/20 1500 Likely Voters +/- 3.0 MOE 47 Romney / 43 Obama
7/2-7/6 1500 Likely Voters +/-3.0 MOE 45 Romney / 45 Obama
7/12-7/14 1500 Likely Voters +/-3.0 MOE 45 Romney / 45 Obama
7/29-7/31 1500 Likely Voters +/-3.0 MOE 47 Romney / 44 Obama
8/8-8/10 1500 LV +/-3 MOE 46 Romney / 44 Obama
8/23-8/25 1500 LV +/-3 MOE 47 Obama / 45 Romney
9/ 7-9/9 1500 LV +/-3 MOE 50 Obama / 45 Romney
9/14-9/16 1500 LV +/- 3 MOE 47 Romney / 45 Obama
10/8-10/9 1000 LV +/- 3 MOE 43 Obama / 41 Romney
10/1-10/3 1500 LV +/-3 MOE 49 Obama / 47 Romney
10/4-10/6 1500 LV +/-3 MOE 49 Romney / 47 Obama
11/3-11/5 1500 LV +/- 3 MOE 48 Romney / 47 Obama
And there’s that (late) summer bump for the Democrat! Even with Rasmussen’s flawed LV profile.
If a poll wants to use LV they should thoroughly explain the profile they use. And just asking people is not good enough.
Isn’t a post-convention bump a historically relevant event?
Nearly all national public opinion polling organizations that use Likely Voter samples ask some variation of these two sets of questions to determine who is a likely voter:
For live interviewer-asked questions—
How much thought have you given to the coming presidential election?
How closely have you been following news about the candidates?
Do you plan to vote in the presidential election? How certain are you that you will vote?
Rate your chance of voting in November on a scale of 10 to 1, with 10 being “definitely will vote” and 1 “definitely will not vote.”
How often do you follow what’s going on in government and public affairs?
Have you ever voted in your precinct or election district?
How often would you say you vote?
Do you happen to know where people in your neighborhood go to vote?
In the last election, did things come up that kept you from voting or did you vote?
“The other big problem with election polling, though not a new one, is that survey respondents overstate their likelihood of voting. It is not uncommon for 60 percent to report that they definitely plan to vote in an election in which only 40 percent will actually turn out. Pollsters have to guess, in effect, who will actually vote, and organizations construct “likely voter” scales from respondents’ answers to maybe half a dozen questions, including how interested they are in the election, how much they care who wins, their past voting history and their reported likelihood of voting in this particular election. Unfortunately, research shows there is no single magic-bullet question or set of questions to correctly predict who will vote, leaving different polling organizations with different models of who will turn out.”
I noticed in one recent poll 80% of respondents said they were registered and 99% of those said they were likely voters LOL!
Now, aome rare polls pay the cost to get voter info and only call people on the voter list. These can make a reasonable estimate of ‘likely voters’.
“because the sample of names is derived from lists of known voters, we know by definition that the person we are seeking is indeed a registered voter. Working off a voter list also provides the pollster with the voter’s actual party registration, as well as his or her frequency of voting in past elections, since this information is contained on the official voting records. This information can also be used to ensure that the sample is aligned properly to the state’s actual party registration and in identifying which voters are most likely to vote.”
Every summer the Rs are polling 6+ points behind their final numbers. Rs have conventions too: so IMO it’s strange. (Obama is different- he had 15% racist climb-over-broken-glass-to-vote-for-him support. Very unusual!
All that is true and yet somehow, a majority of national polling organizations correctly predicted the 2012 presidential election given a plus/minus 3 point margin of error.
2012 Polling Accuracy (Obama won by 3.9%) Actual Result-Obama: 51.1%/Romney-47.2%
Final poll released before the 2012 Election
Politico/GWU/Battleground-(O)47-(R)47
Rasmussen Reports-(R)49%-(O)48
InvestorsBusinessDailyTIPP-(O)50-(R)49
YouGov/Economist-(O)49-(R)47
Gravis Marketing- (R)48-(O)48
JZAnalytics/Newsmax-(O)50-(R)49
UPI/CVoter-(O)49-(R)48
Ipsos/Reuters-(O)48-(R)46
Associated Press/GfK-(R)47-(O)45
Rand-(O)50-(R)46
CNN/Opinion Research-(R)49-(O)49
Gallup-(R)50-(O)49
ABC News/Washington Post-(O)50-(R)47
Monmouth University-(O)48-(R)48
DailyKos/SIEU/PPP-(O)50-(R)48
Democracy Corps-(O)49-(R)45
Angus Reid-(O)51-(R)48
NBC News/Wall Street Journal-(O)48-(R)47
Pew Research-(O)50-(R)47
Quinnipiac U. Polling Institute-(O)49-(R)45
CBS News/New York Times-(O)48-(R)47
National Journal-(O)50-(R)45
Fox News (R)46-(O)46
I expect reputable polls *just before the election* to be within 4%.
Right now I don’t have any of them to look at...
I agree with you that the polls get more accurate later in the election cycle. A new dynamic affecting public opinion polling for elections is the growing preponderance of early voting and absentee ballot voting. 37 states allow voting before election day.
The Commission on Presidential Debates has made their decision on which polls they will use to decide who makes the cut for this fall’s televised verbal sparring matches.
The pollsters that will determine who gets to be on stage come September and October are ABC News/Washington Post, CBS News/New York Times, CNN, Fox News and NBC News/Wall Street Journal.
Wouldn’t it have been useful to have determined the dem/rep ratio based on the 2012 state election results? After all, many who register don’t vote. At least an approximation could be drawn based on those who have demonstrated a willingness to turn out. Then you could compare the turnout percentages relative to the poll weighting to ascertain a more likely accurate result.
Sorry, didn’t mean to nitpick. You’ve obviously done a lot of work and should be congratulated on you effort. Hoping your observations turn out to be good news in the end.
Gallup shows Party ID Nationally as 28-28-42 (R-D-I), if leaners are moved from Ind to Party, you get 43-43-14. ID By state for end on 2015 was added up to get 40.3-42.5-17.1. Pollsters do party ID including leaners as IND or with a party. The numbers I use is based on the way they assign it. in some cases (YouGov, Survey USA) detailed breakouts are used so you can calculate both ways. 20112 is useless because Black turnout was higher for the dems, and anti-Mormon vote was suppressing GOP turnout. 2012 was D+6. A cranky old white woman will have marginal effect on the female turnout for the D’s, and a Presbyterian will be a nothingburger for suppressing turnout for the R’s. Other factors will be involved for sure, but the gender gap is overstated, and Trump getting 1-2-3 % of the black vote is nonsense, and proof that the MSM is fudging polls. Also Trump voter are hanging up on pollsters. We see it here anecdotally at FR, and you hear bout it elsewhere. If the MSM calls me on a robocall, I am a black female lesbian for Stein. If it is a live person I would hang up, except maybe Gravis (OAN) who I would tell the truth to.
Disclaimer: Opinions posted on Free Republic are those of the individual posters and do not necessarily represent the opinion of Free Republic or its management. All materials posted herein are protected by copyright law and the exemption for fair use of copyrighted works.