Posted on 03/29/2020 7:42:31 PM PDT by CaptainK
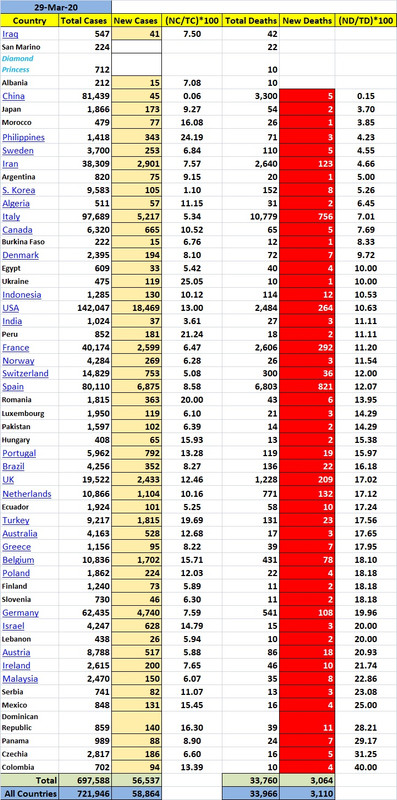
Tell me this, why was the spread in Asia so limited? China’s per capita level is really low. It didn’t spread much beyond the epicenter it seems. South Korea is higher on the per capita level but below Europe, Iran and the U.S. We know they did have a great policy of testing and quarantine.
But also look at Hong Kong, Taiwan, Japan, Philippines, Singapore. Many below the per capita average of cases by country. No explosion in cases like we saw in Europe and are seeing in New York. And many of these are very densely populated countries. You can’t tell me Chinese people weren’t traveling around Asia as much as they were in Europe and the U.S.
So how did Asia at large escape what’s happening in Europe and New York? Is it possible something similar to this virus has existed in animals in Asia going back to pre-history, occasionally crossed over into humans, and that there may be some natural genetic immunity built into people of Asian descent?
Today’s numbers are not in until tomorrow!
Trump said today that 1100 people in NY are being given zpack and hydroxychloroquine, been doing that for the past 2 days
I’m going by their 24 hour count.
Isn’t it interesting that good news is termed suspicious.
People have been posted the stats from Worldometer for weeks without question
.....
Indeed!
I notice they have complete faith in these numbers when infections and death rates are up! In those instances, we must NOT question the veracity of the numbers!
Mass hysteria is a scary thing to behold!
There seems to be a sharp discrepancy between Worldometer and Wikipedia. Wikipedia, which has shown itself to be very consisitent, shows an astonishing 237 deaths in NY. That’s the difference, there, because Worldometer shows only 82. But both arrive at the same total, so it seems that for some reason, Worldometer included a staggering number of them as coming from yesterday’s data (Fri actual deaths), whereas Wikipedia counted them as coming from today’s (Sat’s actual deaths).
Anyway... it shows that there really is a decline happening, but just how noisy the data is.
While New York looks like the worst place to be, DC with it's massive rank differential may be a close second. The top of the bad are New York, New Jersey, Louisiana, Massachusetts, Washington, District of Columbia, Michigan and Connecticut. The best place to be seems like North Carolina, Texas, and Virginia due to their rank differential in a positive way (i.e., lower adjusted rank vs population rank). The best of the good are Nebraska, West Virginia, Texas, South Dakota, Minnestoa and Virginia.
| State | Population (MM) | Confirmed Cases Mar 27 | Cases per 100,000 people | Rank, Confirmed Cases | Rank, Cases per 100,000 people |
| Alabama | 4.9 | 720 | 14.7 | 25 | 27 |
| Alaska | 0.7 | 102 | 13.9 | 48 | 30 |
| Arizona | 7.4 | 773 | 10.5 | 22 | 39 |
| Arkansas | 3.0 | 409 | 13.5 | 31 | 33 |
| California | 39.9 | 5565 | 13.9 | 3 | 29 |
| Colorado | 5.8 | 2061 | 35.3 | 13 | 9 |
| Connecticut | 3.6 | 1524 | 42.8 | 14 | 8 |
| Delaware | 1.0 | 214 | 21.8 | 39 | 17 |
| District of Columbia | 0.7 | 342 | 47.5 | 34 | 6 |
| Florida | 22.0 | 4038 | 18.4 | 7 | 20 |
| Georgia | 10.7 | 2447 | 22.8 | 11 | 13 |
| Hawaii | 1.4 | 151 | 10.7 | 44 | 38 |
| Idaho | 1.8 | 261 | 14.3 | 37 | 28 |
| Illinois | 12.7 | 3547 | 28.0 | 8 | 11 |
| Indiana | 6.7 | 1232 | 18.3 | 17 | 21 |
| Iowa | 3.2 | 298 | 9.4 | 35 | 42 |
| Kansas | 2.9 | 271 | 9.3 | 36 | 43 |
| Kentucky | 4.5 | 394 | 8.8 | 32 | 45 |
| Louisiana | 4.6 | 3315 | 71.4 | 9 | 3 |
| Maine | 1.3 | 211 | 15.7 | 41 | 24 |
| Maryland | 6.1 | 1066 | 17.5 | 18 | 23 |
| Massachusetts | 7.0 | 4257 | 61.0 | 6 | 4 |
| Michigan | 10.0 | 4635 | 46.1 | 4 | 7 |
| Minnesota | 5.7 | 441 | 7.7 | 30 | 47 |
| Mississippi | 3.0 | 669 | 22.4 | 26 | 15 |
| Missouri | 6.2 | 838 | 13.6 | 21 | 31 |
| Montana | 1.1 | 147 | 13.5 | 45 | 32 |
| Nebraska | 2.0 | 122 | 6.2 | 46 | 51 |
| Nevada | 3.1 | 738 | 23.5 | 24 | 12 |
| New Hampshire | 1.4 | 214 | 15.6 | 39 | 25 |
| New Jersey | 8.9 | 11124 | 124.5 | 2 | 2 |
| New Mexico | 2.1 | 208 | 9.9 | 43 | 40 |
| New York | 19.4 | 53363 | 274.5 | 1 | 1 |
| North Carolina | 10.6 | 972 | 9.2 | 20 | 44 |
| North Dakota | 0.8 | 94 | 12.3 | 49 | 35 |
| Ohio | 11.7 | 1406 | 12.0 | 15 | 36 |
| Oklahoma | 4.0 | 377 | 9.5 | 33 | 41 |
| Oregon | 4.3 | 479 | 11.1 | 29 | 37 |
| Pennsylvania | 12.8 | 2815 | 22.0 | 10 | 16 |
| Rhode Island | 1.1 | 239 | 22.6 | 38 | 14 |
| South Carolina | 5.2 | 660 | 12.7 | 27 | 34 |
| South Dakota | 0.9 | 68 | 7.5 | 51 | 48 |
| Tennessee | 6.9 | 1373 | 19.9 | 16 | 18 |
| Texas | 29.5 | 2161 | 7.3 | 12 | 49 |
| Utah | 3.3 | 608 | 18.5 | 28 | 19 |
| Vermont | 0.6 | 211 | 33.6 | 41 | 10 |
| Virginia | 8.6 | 740 | 8.6 | 23 | 46 |
| Washington | 7.8 | 4311 | 55.3 | 5 | 5 |
| West Virginia | 1.8 | 113 | 6.4 | 47 | 50 |
| Wisconsin | 5.9 | 1042 | 17.8 | 19 | 22 |
| Wyoming | 0.6 | 84 | 14.8 | 50 | 26 |
Yes, that’s an error in the Confirmed Cases column; the date should be Mar 28. My bad.
If I’m not mistaken worldometer updates on GMT. But it’s still a drop.
Worldometer:
3/27 1696 +401
3/28 2221 +525
3/29 2484 +264
Wikipedia
3/27 1591 +432
3/28 2038 +438
3/29 2424 +385
Yes, but their day ends at 4 pm so they would have included late news yesterday on New York’s casualties ion today’s list.
I honestly think New York didn’t get around to reporting the late Sunday numbers. If they only had 82 casualties today, it would be unbelievable. However, much of the rest of the country was down as well, so today’s numbers have to be considered a good thing. Not an “it’s over, we won” thing, but a good day. It will probably be a terrible day tomorrow if they include the late Sunday New York numbers with tomorrow. But if we combine the two days, we’ll probably see a flattening.
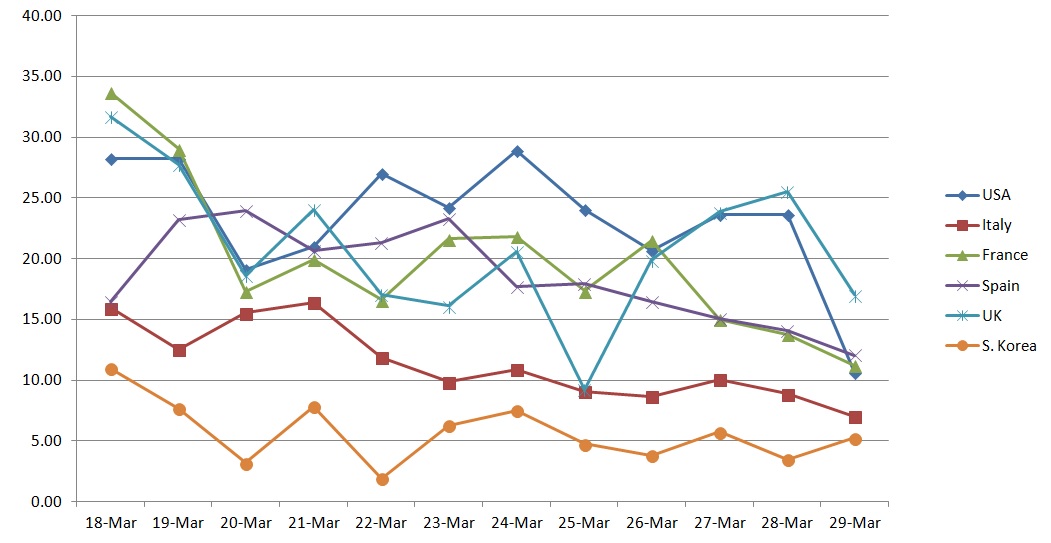
Yes, the deaths in New York were way down. They were something like 275 deaths yesterday, hence they are driving the data. I think all the models are very suspect. Why rely on models for the rest of the country, when we have actual data available from New York. I am also watching France since they seem to be a few weeks in front of us.
Bttt
Yeah with all of the MASKS the ventilators, the new meds...and now the ships...numbers will start to come down. By Easter we can all be back to work.. Bank on it.
The worldometers site is showing the same number of total US deaths as covidtracking.com - 2,484.
Worldometers begins its daily count at 00:00 GMT. That may account for the daily difference.
Which is problemmatic since the most consistent datasources are the states themselves, and they each update at different times during the day, once a day.
So I’m guessing Wikipedia is going to prove to be less noisy, but it will be just as promising.
Suppose if the next day is 300... Worldometer will look like the deaths are going up again, but Wikipedia will show a continuing, steadier, healthy trend.
Sunday is always down, then there is a jump on Monday. Staffing. That’s happened the last 2 weekends.
It would be nice if that weren’t the case this weekend.
IIRC, all of the top nine countries are down in number of new cases from yesterday. Italy peaked 8 days ago.
The problem is the death rate drop needs to follow the case rate drop. A drop in the death rate now tells us that the full data hasn’t been collected for the day.
If that’s true, we’ll see a big jump tomorrow. I’d like to be wrong, but I just don’t see it in the numbers.
Disclaimer: Opinions posted on Free Republic are those of the individual posters and do not necessarily represent the opinion of Free Republic or its management. All materials posted herein are protected by copyright law and the exemption for fair use of copyrighted works.