Posted on 02/26/2010 10:45:29 PM PST by Ernest_at_the_Beach
************************************
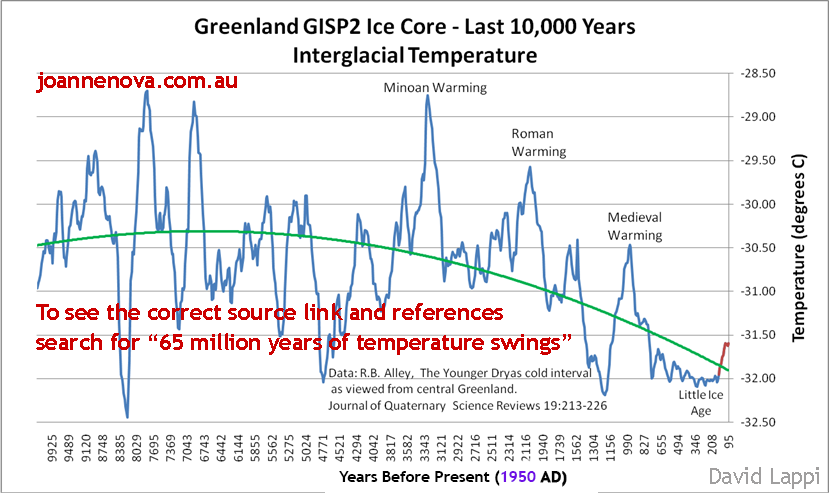
Greenland Temperatures - last 10,000 years. Are we headed for an ice age? (See below for more detail.)
David Lappi is a geologist from Alaska who has sent in a set of beautiful graphs–including an especially prosaic one of the last 10,000 years in Greenland–that he put together himself (and which I’ve copied here at the top).
If you wonder where today’s temperature fits in with the grand scheme of time on Earth since the dinosaurs were wiped out, here’s the history. We start with the whole 65 million years, then zoom in, and zoom in again to the last 12,000 from both ends of the world. What’s obvious is that in terms of homo sapiens history, things are warm now (because we’re not in an ice age). But, in terms of homo sapiens civilization, things are cooler than usual, and appear to be cooling.
Then again, since T-rex & Co. vanished, it’s been one long slide down the thermometer, and our current “record heatwave” is far cooler than normal. The dinosaurs would have scoffed at us: “What? You think this is warm?”
With so much volatility in the graphs, anyone could play “pick a trend” and depending on which dot you start from, you can get any trend you want. — Jo
**********************************************************
GUEST POST by David Lappi
The following two graphs (images created by Robert A. Rohde / Global Warming Art) are climate records based on oxygen isotope thermometry of deep-ocean sediment cores from many parts of the world [1]). On both graphs, colder temperatures are toward the bottom, and warmer temperatures toward the top. Significant temperature events on the first graph show the start and end of Antarctic glaciation 34 and 25 million years ago, and the resumption of glaciation about 13 million years ago. It is obvious from the graph that we are now living in the coldest period of Earth’s history for the last 65 million years. Despite recent rumors of global warming, we are actually in a deep freeze.

65 million years of global temperatures Image created by Robert A. Rohde / Global Warming Art
Image created by Robert A. Rohde / Global Warming Art
The last five million years of climate change is shown in the next graph based on work by Lisiecki and Raymo in 2005 [2] . It shows our planet has a dynamic temperature history, and over the last three million years, we have had a continuous series of ice ages (now about 90,000 years each) and interglacial warm periods (about 10,000 years each). There are 13 (count ‘em) ice ages on a 100,000 year cycle (from 1.25 million years ago to the present, and 33 ice ages on a 41,000 year cycle (between 2.6 million and 1.25 million years ago). Since Earth is on a multi-million-year cooling trend, we are currently lucky to be living during an interglacial warm period, but we are at the end of our normal 10,000 year warm interglacial period.

65 million years of global temperatures
Image created by Robert A. Rohde / Global Warming Art
To detail the more recent prehistoric temperature changes, scientists have drilled a number of ice cores in ancient glacial ice. Paleotemperature data from ice cores is considered to be our best continuous record of temperatures on the planet for time-spans up to about 420,000 years ago. Annual layering in undisturbed glacial ice allows us to precisely date the layers, and gives us a very accurate time and temperature sequence. The US government drilled the GISP 2 ice core in central Greenland over a five-year period, and the data is available here. This data set is useful because it reports temperatures (measured by oxygen isotopes) every 10 to 60 years — a good resolution. I sometimes see graphs of ice-core temperatures or greenhouse gasses that are based on measurements every 1,000 or 2,000 years: not nearly of close enough together for comparisons that are useful today. I downloaded and graphed these data in Excel myself. The following graphs have a time scale in years Before Present (BP).
The next graph of temperature from the ice core for the last 10,000 years (the current interglacial period) shows that Greenland is now colder than for most of that period (vertical scale in degrees C below zero). We can see the Medieval Warm Period 800 to 1,000 years ago was not particularly warm, and the Little Ice Age 150 to 650 years ago was one of the longest sustained cold periods during this interglacial. We are now recovering from this abnormal cold period, and the recovery started long before anthropogenic greenhouse gases were produced in any quantity. The curved trend line in green shows that we have been experiencing declining temperatures for the past 3,000 years, and are likely to be heading down toward the next ice age. Temperatures are only considered to be increasing if viewed for the last 150 years, from 1850 onward, which is roughly when thermometers began collecting global data, and is also the period of time the UN’s Intergovernmental Panel on Climate Change (IPCC) has chosen for its review. The red portion of the curve is the recovery from the Little Ice Age. The amount of 20th century warming is unknown, since it was recently revealed that unknown portions of the international temperature databases have been tampered with, and the amount and extent of the tampering has not been publicly documented. It is likely that some warming has continued into the 20th century, but it is also likely that the amount of warming is not as great as the 0.6 degrees C that the global warming advocates would lead us to believe.
Our current warming is well within natural variation, and in view of the general decline in temperatures during the last half of this interglacial, is probably beneficial for mankind and most plants and animals. The graph clearly shows the Minoan Warming (about 3200 years ago), the Roman Warming (about 2000 years ago), and the Medieval Warm Period (about 900 years ago). Great advances in government, art, architecture, and science were made during these warmer times.
********************************************************
fyi
Leave it to the Liberals to decry a small step toward normalcy as evil.
I’m getting a chill just reading this thing.
It's a cycle, it's a cycle, it's a cycle!
********************
A True Inquiry Into Climate & Weather, Part 1: A Hot Potato
Humans have nothing to do with it
3 Nov 09 - Listen to this eye-opening interview with author Robert Felix,
climatologist Dr. Timothy Ball and meteorologist Joe D’Aleo on
"It's Rainmaking Time! with Kim Greenhouse"
Listen free:
http://itsrainmakingtime.com/2009/climate-part1/
(When you get there, click on the words "Click here to stream")
About the participants
Dr. Timothy Ball is a renowned environmental consultant and retired climatology professor at the University of Winnipeg. Dr. Ball has a B.A. from the University of Winnipeg, an M.A. from the University of Manitoba in 1970 in Geography, and a Ph.D. in climatology from the University of London, England.
Joseph D’Aleo, executive director of http://icecap.us, was the first Director of Meteorology at the cable TV Weather Channel. A former college professor of meteorology, D’Aleo has served as a member and then chairman of the American Meteorological Society’ Committee on Weather Analysis and Forecasting, and has co-chaired national conferences for both the American Meteorological Society and the National Weather Association.
Robert W. Felix, author of two internationally acclaimed science books - Not by Fire but by Ice and Magnetic Reversals and Evolutionary Leaps - is the host and creator of www.iceagenow.com and www.evolutionaryleaps.com. He has given more than 300 radio interviews in the U.S. and Canada presenting his view that the next ice age could begin any day.
Kim Greenhouse is host and creator of www.itsrainmakingtime.com. Kim is a communications steward, pioneer, and rainmaker for a better world who loves to bring new knowledge and unique opportunities to those who are ready, willing, and receptive.
Thanks, Kim, for the huge amount of work that you've put into this, not
only for conducting the interview, but for all of your homework and for
taking the time to read both of my books prior to the interview. If only
other hosts were that conscientious.
* * *
Hi Robert, Tim, Joe,
WOW!! Have sat through your two-hour radio interview, WOW!!!!!
What a fantastic mega-bullet to the climate alarmists, jeez, how can anyone still accept that man is affecting the climate is way beyond me.
Also superb to hear you guys cover the global governance issue, the one and only true driver that makes sense, after all is said and done.
Thank you, thank you, thank you, all three of you, for your superb effort.
How can we collectively stop this insane official behaviour?!
Who has the power to prick the man-made climate-change balloon?
Best regards,
Hans Schreuder
www.nothingtodowithco2.com/pdf/AGW_presentation_ILMCD.pdf
lol at 65 million
****************************EXCERPT******************************
Something seriously wrong
1 Jan 10 - (Excerpts) - "Few significant products are driven to commercialism, validated by claims of the scientific community. Before investing in a new product, those committing funds almost always look to an Engineering Study or Engineering Design Review, rather than using only the claims of Scientists. This is not being done at all, with the AGW-planet crisis issue.
"One has only to look at the two most notable charts (below) from two United Nations IPCC summary reports, published a decade apart, to realize that something might be seriously wrong.

Estimated average global temperatures for the last thousand years
"The fact that the 2001 “hockey stick” chart was presented in color in several sections of the 2001 IPCC report, without explaining how the scientists managed to completely eliminate their earlier depiction of the Medieval Warm Period and the Little Ice Age (both are well covered in historical documents as well as scientific analysis is unacceptable behavior. (http://www.co2science.org/data/mwp/mwpp.php)
"Noting that the “hockey stick” chart was removed in later editions of the IPCC “scientific” reports supports the conclusion that something is indeed wrong. It was removed because an outside investigation was conducted that resembled a proper engineering review - with a finding of fraud.
"Specifically, the fraud was identified by showing that the critical data for the chart came from cherry picking just a handful of Siberian trees (tree ring proxy to estimate temperature), without evidence that the researcher applied the proper scientific method. Using all the data or any random selection of 10% of the tree ring data showed no significant correlation of planet warming to human CO2 emissions.
Fraud not limited to cherry picking
"The fraud was not limited to the tree cherry picking. The computer code for presentation had been tweaked such that a hockey stick shape is produced even if the data set is developed with a random number generator!
"The horrific result of this scandal was that the 2001 UN hockey stick chart formed the very foundation of a non-scientific theory that resulted in the awarding of a Nobel Peace Prize, a movie Oscar and a best-selling book.
John Coleman's Global Warming Special Now on YouTube
Link to IceAgeNow with several choices there
Graphic from the article:
The big picture: 65 million years of temperature swings
***************************************EXCERPT*****************************
bump
ping
Indeed, a glaciation is probable to happen in a period extending to the next ten thousand years, and the fact is that Earth is cooling right now.
Glaciation would be more destructive than the damage any global warming theory predicted, could you imagine Manhattan buried in mile and a half of ice?
Indeed, a glaciation is probable to happen in a period extending to the next ten thousand years, and the fact is that Earth is cooling right now.
Glaciation would be more destructive than the damage any global warming theory predicted, could you imagine Manhattan buried in mile and a half of ice?
bttt
Nite all!
Was just on the Earthquake thread....8.8 off coast of Chile...that is Huge.
Great posting! Bookmarked.
Disclaimer: Opinions posted on Free Republic are those of the individual posters and do not necessarily represent the opinion of Free Republic or its management. All materials posted herein are protected by copyright law and the exemption for fair use of copyrighted works.