Posted on 03/31/2008 7:31:14 AM PDT by Momaw Nadon
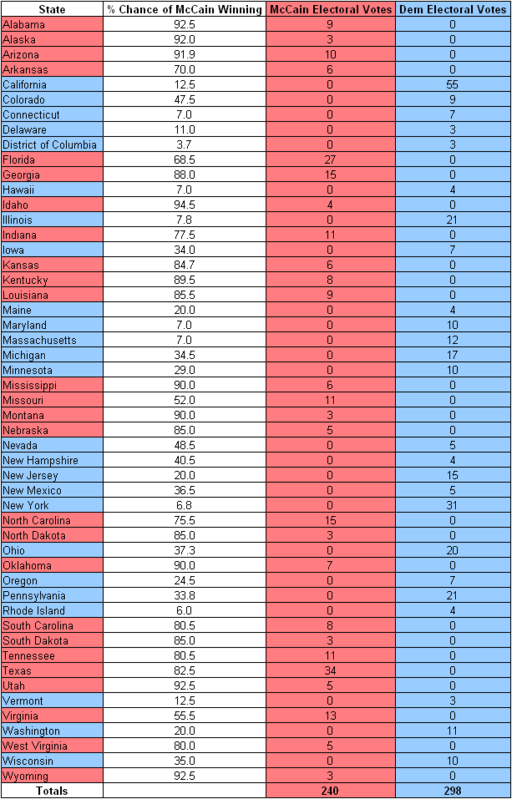
According to the current trading prices of the futures contracts, an estimate can be found of what traders are betting will be the outcome of 2008 Presidential Election.
If the traders are correct, John McCain would receive 240 Electoral Votes and the Democratic Presidential candidate would receive 298 Electoral Votes.
If the weighted probabilities of John McCain winning in the states are added up, and then divided by 538, and multiplied by 100, then John McCain should get 252.22 Electoral Votes.
270 Electoral Votes are needed to win the Presidency.
Opinions and commentary are welcome.
2008 Projected Presidential Electoral Votes as of 3/24/2008
2008 Projected Presidential Electoral Votes as of 3/17/2008
2008 Projected Presidential Electoral Votes as of 3/10/2008
2008 Projected Presidential Electoral Votes as of 3/3/2008
2008 Projected Presidential Electoral Votes as of 2/25/2008
2008 Projected Presidential Electoral Votes as of 2/18/2008
2008 Projected Presidential Electoral Votes as of 2/11/2008
2008 Projected Presidential Electoral Votes as of 2/4/2008
2008 Projected Presidential Electoral Votes as of 1/28/2008
2008 Projected Presidential Electoral Votes as of 1/21/2008
2008 Projected Presidential Electoral Votes as of 1/14/2008
2008 Projected Presidential Electoral Votes as of 1/7/2008
So long as the voters in (*yeccchhh*) Seattle continue to disproportionately determine how the state’s electoral votes are allotted, every four years: Washington, I solemnly guarantee you, will never EVER go for Juan over The Obamessiah.
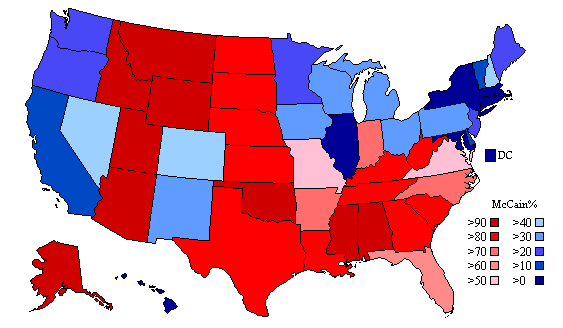
looks like it is trending McCains way
according to this thing if he held all the states indicated here and carried a few others he may actually win this thing
Put me on your list, please.
Republicans never do well against generic Democrats. Generic Democrats never make it onto the ballot.
Add me as well.
pretty much every state has that situation where major metro area(s) dominate(s) the rest of the state, i.e., NY/CA/NV/IL/MI for starts.
| 50 Largest Cities | 2005 Est Pop |
Dem Cities |
GOP Cities |
||
New York |
N.Y. |
8,143,197 |
8,143,197 |
||
Los Angeles |
Calif. |
3,844,829 |
3,844,829 |
||
Chicago |
Ill. |
2,842,518 |
2,842,518 |
||
Houston |
Tex. |
2,016,582 |
2,016,582 |
||
Philadelphia |
Pa. |
1,463,281 |
1,463,281 |
||
Phoenix |
Ariz. |
1,461,575 |
1,461,575 |
||
San Antonio |
Tex. |
1,256,509 |
1,256,509 |
||
San Diego |
Calif. |
1,255,540 |
1,255,540 |
||
Dallas |
Tex. |
1,213,825 |
1,213,825 |
||
San Jose |
Calif. |
912,332 |
912,332 |
||
Detroit |
Mich. |
886,671 |
886,671 |
||
Indianapolis |
Ind. |
784,118 |
784,118 |
||
Jacksonville |
Fla. |
782,623 |
782,623 |
||
San Francisco |
Calif. |
739,426 |
739,426 |
||
Columbus |
Ohio |
730,657 |
730,657 |
||
Austin |
Tex. |
690,252 |
690,252 |
||
Memphis |
Tenn. |
672,277 |
672,277 |
||
Baltimore |
Md. |
635,815 |
635,815 |
||
Fort Worth |
Tex. |
624,067 |
624,067 |
||
Charlotte |
N.C. |
610,949 |
610,949 |
||
El Paso |
Tex. |
598,590 |
598,590 |
||
Milwaukee |
Wis. |
578,887 |
578,887 |
||
Seattle |
Wash. |
573,911 |
573,911 |
||
Boston |
Mass. |
559,034 |
559,034 |
||
Denver |
Colo. |
557,917 |
557,917 |
||
Louisville-Jefferson County |
Ky.1 |
556,429 |
556,429 |
||
WashingtonDC |
|||||
Nashville-Davidson |
Tenn.2 |
549,110 |
549,110 |
||
Las Vegas |
Nev. |
545,147 |
545,147 |
||
Portland |
Ore. |
533,427 |
533,427 |
||
Oklahoma City |
Okla. |
531,324 |
531,324 |
||
Tucson |
Ariz. |
515,526 |
515,526 |
||
Albuquerque |
N.M. |
494,236 |
494,236 |
||
Long Beach |
Calif. |
474,014 |
474,014 |
||
Atlanta |
Ga. |
470,688 |
470,688 |
||
Fresno |
Calif. |
461,116 |
461,116 |
||
Sacramento |
Calif. |
456,441 |
456,441 |
||
New Orleans |
La. |
454,863 |
454,863 |
||
Cleveland |
Ohio |
452,208 |
452,208 |
||
Kansas City |
Mo. |
444,965 |
444,965 |
||
Mesa |
Ariz. |
442,780 |
442,780 |
||
Virginia Beach |
Va. |
438,415 |
438,415 |
||
Omaha |
Nebr. |
414,521 |
414,521 |
||
Oakland |
Calif. |
395,274 |
395,274 |
||
Miami |
Fla. |
386,417 |
386,417 |
||
Tulsa |
Okla. |
382,457 |
382,457 |
||
Honolulu |
HI |
377,379 |
377,379 |
||
Minneapolis |
Minn. |
372,811 |
372,811 |
||
Colorado Springs |
Colo. |
369,815 |
369,815 |
||
Arlington |
Tex. |
362,805 |
362,805 |
||
| Total population | 45,317,550 |
28,655,883 |
16,661,667 |
||
PA has been going blue for a while now. Looks like Ohio is going that way, too. If the Rats win Ohio in November then McCain loses.

Of course they do; nor have I ever argued otherwise. The unvarnished fact remains, however: Seattle will always, ALWAYS tack towards the left-most candidate, in any given election... and, as Seattle goes, so too (sadly) does the rest of the state, electorally.
Them's the facts, like 'em or otherwise (amd I, plainly, do not).
Given all the Republican-related scandals in that state over the past few years -- all still distressingly fresh, doubtless, in the minds of the "swing" voters therein -- I'd be stunned and then some were ANY Republican nominee for the presidency to end up carrying Ohio in '08, personally... although I'm certainly willing to be convinced otherwise, should any Ohio FReepers care to weigh in to that effect.
Add in the fact that the drive-by media will be constantly wailing about the “horrible” economy and you get an almost no-win scenario for McCain. A lot can still happen until November, but it sure isn’t looking good.
hey, don’t complain to ME ... I’m (originally) from New York .. you think Seattle is bad? ha!!!
But .... what happened in ‘84 ??? Reagan carried all but Mondale’s home state. How did RWR capture the electoral votes of places like NY/CA/WA, etc ? Were we that different a people then? Reagan was as bashed in the press in those days as W is now. He was portrayed as a heartless, OLD, gun-slinger who’d bring us to the brink of nuclear war. Yet, he won overwhelmingly. I’d love to figure out when/how we went so far off-track and became so divided.
Once you have Obama's name in there instead of "generic Democrat", you'll see this flip to McCain 285, Obama 253.
Reader's Digest condensed answer: this state was a vastly, almost inconceivably different sort of place a quarter-century ago, than it is today -- long, looonnnnnnnnnng before countless unwashed, sandaled, patchouli-drenched hordes of liberals from CA, OR and (now that you mention it) NY descended upon us, en masse, after Seattle's being hailed nationwide, back in the '80s, as "The Most Liveable City In the U.S.!" (Grrrrrrrrr.)
It's still quite the sore spot with a great many of us hereabouts, quite frankly... and for obvious reasons. My apologies if I sounded snappish. ;)
Disclaimer: Opinions posted on Free Republic are those of the individual posters and do not necessarily represent the opinion of Free Republic or its management. All materials posted herein are protected by copyright law and the exemption for fair use of copyrighted works.