According to the current trading prices of the futures contracts, an estimate can be found of what traders are betting will be the outcome of 2008 Presidential Election.
If the traders are correct, John McCain would receive 227 Electoral Votes and Barack Obama would receive 311 Electoral Votes.
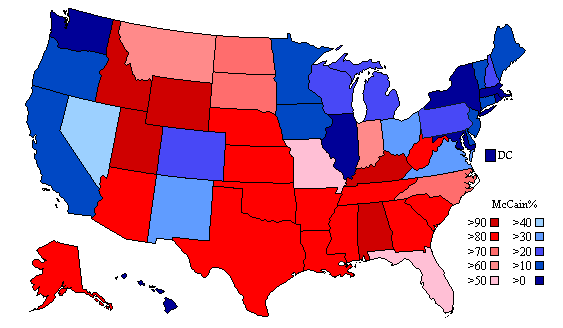
If the weighted probabilities of John McCain winning in the states are added up, and then divided by 538, and multiplied by 100, then John McCain should get 231.61 Electoral Votes.
270 Electoral Votes are needed to win the Presidency.
Opinions and commentary are welcome.
2008 Projected Presidential Electoral Votes as of 7/14/2008
2008 Projected Presidential Electoral Votes as of 7/7/2008
2008 Projected Presidential Electoral Votes as of 6/30/2008
2008 Projected Presidential Electoral Votes as of 6/23/2008
2008 Projected Presidential Electoral Votes as of 6/16/2008
2008 Projected Presidential Electoral Votes as of 6/9/2008
2008 Projected Presidential Electoral Votes as of 6/2/2008
2008 Projected Presidential Electoral Votes as of 5/26/2008
2008 Projected Presidential Electoral Votes as of 5/19/2008
2008 Projected Presidential Electoral Votes as of 5/12/2008
2008 Projected Presidential Electoral Votes as of 5/5/2008
2008 Projected Presidential Electoral Votes as of 4/28/2008
2008 Projected Presidential Electoral Votes as of 4/21/2008
2008 Projected Presidential Electoral Votes as of 4/14/2008
2008 Projected Presidential Electoral Votes as of 4/7/2008
2008 Projected Presidential Electoral Votes as of 3/31/2008
2008 Projected Presidential Electoral Votes as of 3/24/2008
2008 Projected Presidential Electoral Votes as of 3/17/2008
2008 Projected Presidential Electoral Votes as of 3/10/2008
2008 Projected Presidential Electoral Votes as of 3/3/2008
2008 Projected Presidential Electoral Votes as of 2/25/2008
2008 Projected Presidential Electoral Votes as of 2/18/2008
2008 Projected Presidential Electoral Votes as of 2/11/2008
2008 Projected Presidential Electoral Votes as of 2/4/2008
2008 Projected Presidential Electoral Votes as of 1/28/2008
2008 Projected Presidential Electoral Votes as of 1/21/2008
2008 Projected Presidential Electoral Votes as of 1/14/2008
2008 Projected Presidential Electoral Votes as of 1/7/2008
Curious.
These numbers haven’t changed much.
Yet polls over the weekend were showing McCain and Obama nearly tied nationwide.
The popular vote polls seem to favor McCain.
The electoral vote count websites seems to show McCain 220-235 and Obama over 300.
One website recently did show McCain in the 265 range, but Obama still was winning.
Take McCain’s 227 and add Colorado, Virginia and Ohio and you get a 269-269 tie. If you thought the Dems were nuts in 2000, just wait until that happens. The tiebreaker goes to the House of Representatives with each state getting one vote. The screams from California getting the same one vote Alaska has would be wonderful.
If Hillary won the nomination, she would be lock to win Ohio and McCain would be screwed.
Pretty depressing. I believe in these virtual markets more than the polls. Very disappointing McCain is running so poorly in the Southwest. One would think he should be doing much better being from AZ and his views more a fit for this region. Based on the current adds McCain will get blown away in the region losing CO, NM, and NV.
Wonder what the John Kerry stats of 04 where?
| Week | GOP Electoral Votes |
Probability of 270 |
|---|---|---|
| 7-Jan | 241.05 | 20.18% |
| 14-Jan | 235.29 | 14.70% |
| 21-Jan | 234.76 | 14.66% |
| 28-Jan | 236.58 | 15.44% |
| 4-Feb | 236.26 | 15.41% |
| 11-Feb | 237.25 | 16.43% |
| 18-Feb | 230.61 | 12.69% |
| 25-Feb | 233.56 | 15.44% |
| 3-Mar | 234.54 | 16.27% |
| 10-Mar | 240.26 | 22.49% |
| 17-Mar | 244.58 | 24.60% |
| 24-Mar | 249.73 | 28.50% |
| 31-Mar | 252.18 | 30.87% |
| 7-Apr | 248.97 | 27.60% |
| 14-Apr | 249.24 | 27.62% |
| 21-Apr | 247.86 | 25.60% |
| 28-Apr | 251.65 | 29.06% |
| 5-May | 250.84 | 28.07% |
| 12-May | 252.31 | 29.25% |
| 19-May | 248.73 | 25.99% |
| 26-May | 250.15 | 27.10% |
| 2-Jun | 248.98 | 26.46% |
| 9-Jun | 247.87 | 26.81% |
| 16-Jun | 248.41 | 26.06% |
| 23-Jun | 233.92 | 15.76% |
| 30-Jun | 234.84 | 16.21% |
| 14-Jul | 237.43 | 19.14% |
| 21-Jul | 231.61 | 14.15% |
For comparison, the results of 20,000 simulations of another model based on Rasmussen state-by-state polls as of 21-July are: GOP Electoral Votes = 242.84, Probability of 270 = 7.08%. The sensitivity of the Rasmussen state-by-state polls is such that a 1.25% reduction in Obama polling and a 1.25% increase in McCain polling results in a tie in the Electoral College in my simulations.
-PJ
Yikes, it got worse? Obama seems even more pathetic than ever!